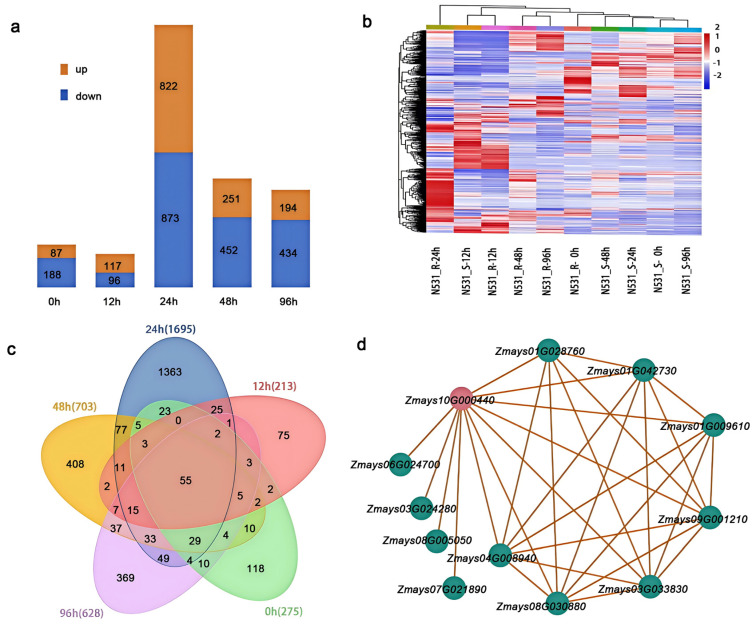
Figure 4.
A differential expression gene analysis of N531_R and N531_S. (a) The numbers of up- and downregulated DEGs in N531_R compared with N531_S. (b) A heatmap of the DEGs among different samples. (c) A Venn diagram of DEGs in different treatments. (d) A gene co-expression regulatory network analysis of Zmays10G000440. The values presented are the means ± standard deviations of the data.

