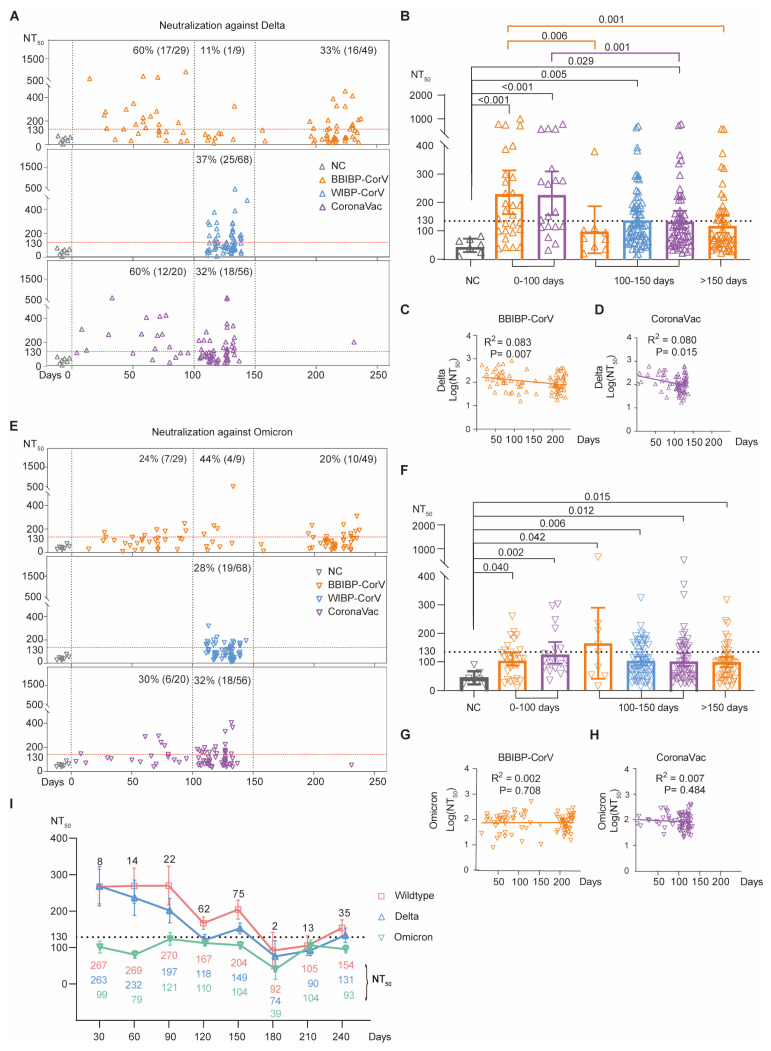
Figure 4.
Durability of serum neutralizing activity against Delta and Omicron (B.1.1.529) variants. (A,E) Serum neutralization against Delta (A) or Omicron B.1.1.529 (E) variants at different time points post-vaccination. Each dot represents a donor: uninfected unvaccinated NC donors (gray), and BBIBP-CorV- (orange), WIBP-CorV- (blue), and CoronaVac-vaccinated donors (purple). For each donor, x-axis represents the number of days after primary vaccination for blood donation; while the y-axis shows the measured serum neutralizing titer (NT50 value) against the Delta (up-pointing triangle, A) or Omicron (B.1.1.529) (down-pointing triangle, E) variants. Three different time periods are separated by vertical dashed lines: 0~100 days, 100~150 days, and >150 days after 2nd-dose inactivated vaccination. The NT50 values of all NC serum samples (gray square) are below 130 (horizontal dashed line) and the percentages of the donors with serum neutralizing titers higher than 130 are shown within each group. (B,F) Comparison of serum neutralizing titers against Delta (B) or Omicron (B.1.1.529) (F) variants for different groups of donors. The p-values are calculated using Kruskal–Wallis test. (C,D) Correlations between the days post-vaccination (x-axis) and the log(NT50 against Delta) of BBIBP-CorV (C) or CoronaVac (D) (y-axis). (G,H) Correlations between the days post-vaccination (x-axis) and the log(NT50 against Omicron B.1.1.529) of BBIBP-CorV (G) or CoronaVac (H) (y-axis). (I) Summary of serum neutralization for all vaccinated donors at different time points. The average NT50 values (y-axis) against wildtype SARS-CoV-2, and Delta and Omicron (B.1.1.529) variants at different time points (x-axis) were calculated and are shown beneath the curves.

