FIG. 1.
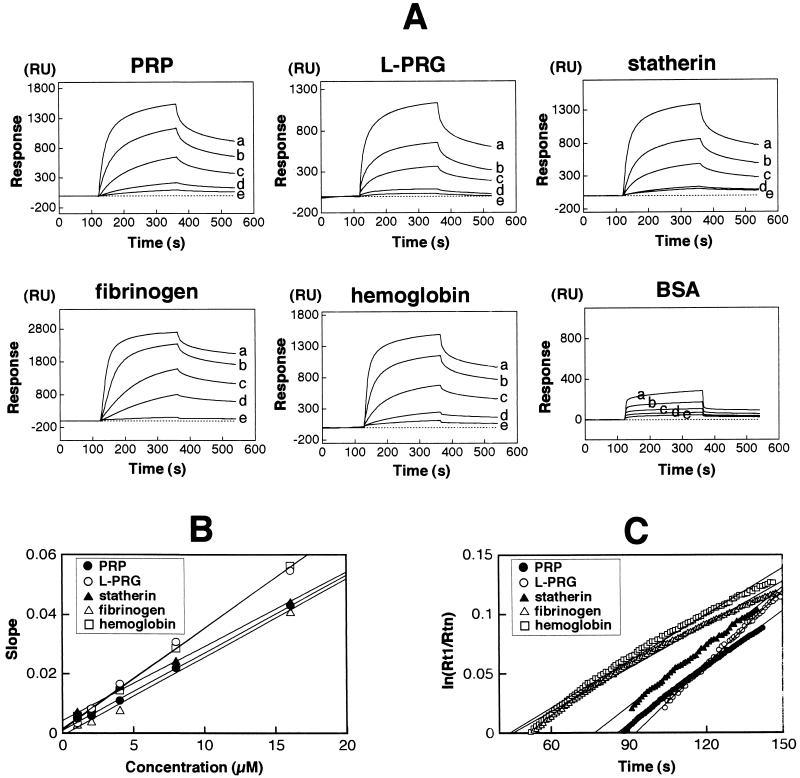
Estimation of fimbrial binding affinity to the host proteins by the BIAcore system. The same molar amount of each host protein was immobilized on the matrix of the chip. Fimbriae were injected at flow rate 10 μl/min for 240 s. (A) The binding ability of fimbriae to each host protein was monitored and presented as a sensogram (plotted as RU versus time). For kinetic studies, fimbriae with increasing concentrations (a, 16 μM; b, 8 μM; c, 4 μM; d, 2 μM; e, 1 μM) were injected over the sensor chip. (B) Kinetic analysis of fimbrial binding to host proteins. A plot of dRU/dt versus RU (slope) was calculated from the sensograms, and then the slopes at different concentrations were replotted against the concentrations of fimbriae. The different angles of the obtained linear lines represent the variation of the affinities, giving the kas from equation 1. (C) kdis (1/s) was determined directly from the linear lines of the plots at the dissociation phase. A ln(Rt1/Rtn) plot was calculated [Rt1 is the RU at the initial phase of dissociation (t1), and Rtn is the RU at time tn] and replotted against the times. The angles of the regression linear lines represent resistibility to dissociation.

