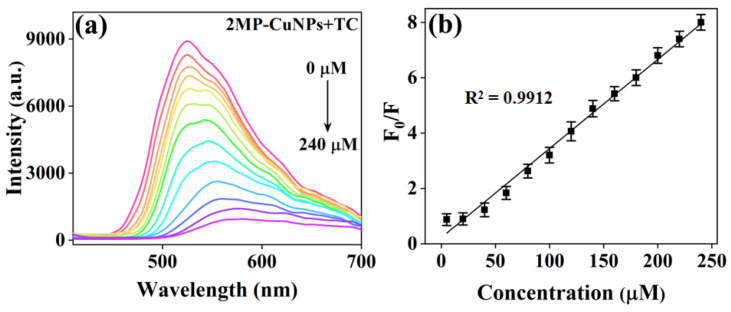
Figure 6.
(a) Fluorescence spectra of 2MP-CuNPs probes at tetracycline (TC) concentrations ranging from 0 to 240 µM (λex = 200 nm, lem = 500 nm); (b) linear plot showing the relationship between the relative fluorescence intensity (F₀/F) of 2MP-CuNPs probes and TC concentration within the 5 to 240 µM range.

