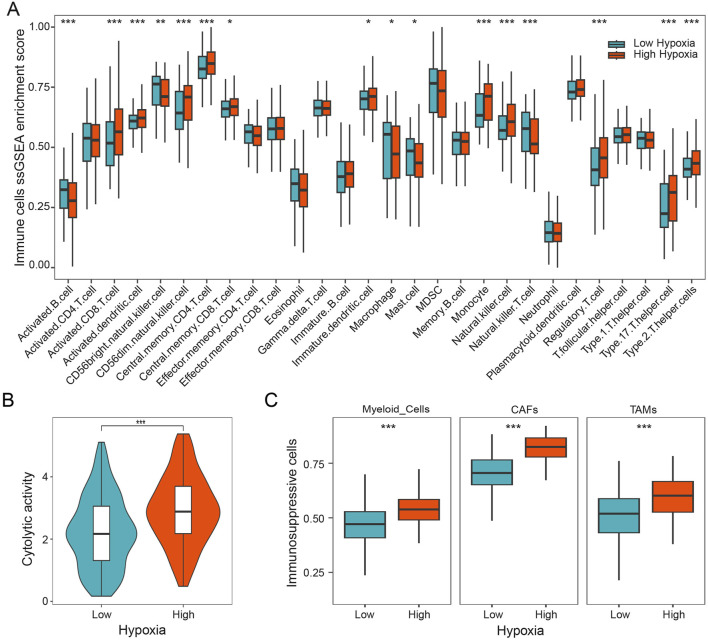
FIGURE 2.
Hypoxia is associated with immunosuppressive microenvironment. (A) Infiltration 28 immune cell types in HGSOC with different hypoxia groups. (B) The cytolytic activity of patients in different hypoxia groups. (C) The relative content of myeloid cells, CAFs, and TAMs in different hypoxia groups. *, p < 0.05; **, p < 0.01; ***, p < 0.001.

