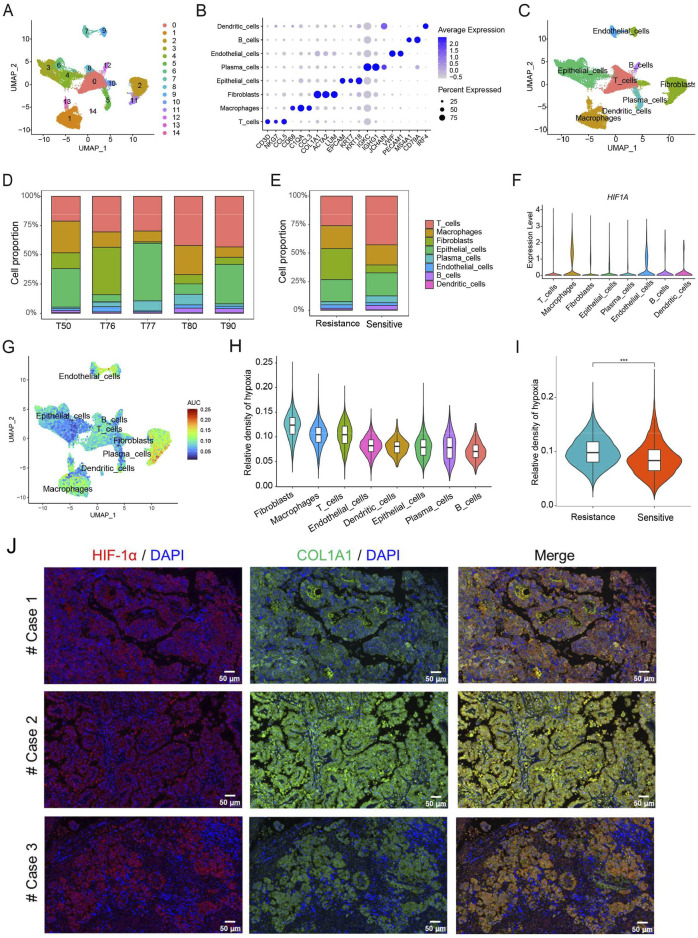
FIGURE 3.
Analysis of hypoxia in the TME at the level of single-cell RNA sequencing. (A) The UMAP plot displays 15 cell types in HGSOC. (B) The specific marker genes in each cell types. (C) Eight cell types annotation. (D) Proportion of eight cell types. (E) Proportion of eight cell types in chemotherapy-sensitive and resistant patients. (F) Expression levels of HIF-1A in eight cell types. (G) Hypoxia score across single cells. (H) Hypoxia score among eight distinct cell types. (I) The differences of hypoxia score between chemotherapy-sensitive and resistant patients. (J) Immunofluorescence staining of HIF-1α and COL1A1 in HGSOC patients. ***, p < 0.001.

