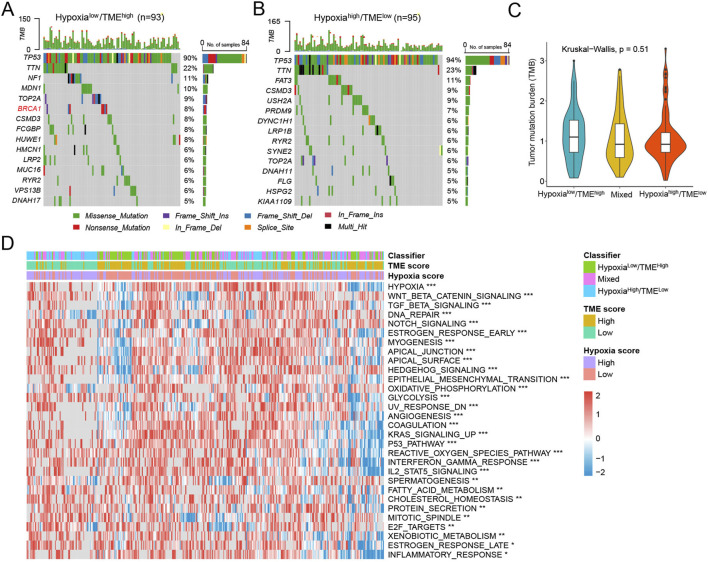
FIGURE 7.
Molecular characteristics in different Hypoxia-TME subgroups. (A) Oncoplot of 15 mutated genes in the Hypoxialow/TMEhigh group. (B) Oncoplot of 15 mutated genes in the Hypoxiahigh/TMElow group. (C) TMB among Hypoxia-TME classifier subgroups. (D) Heatmap of signaling pathways in different Hypoxia-TME subgroups.

