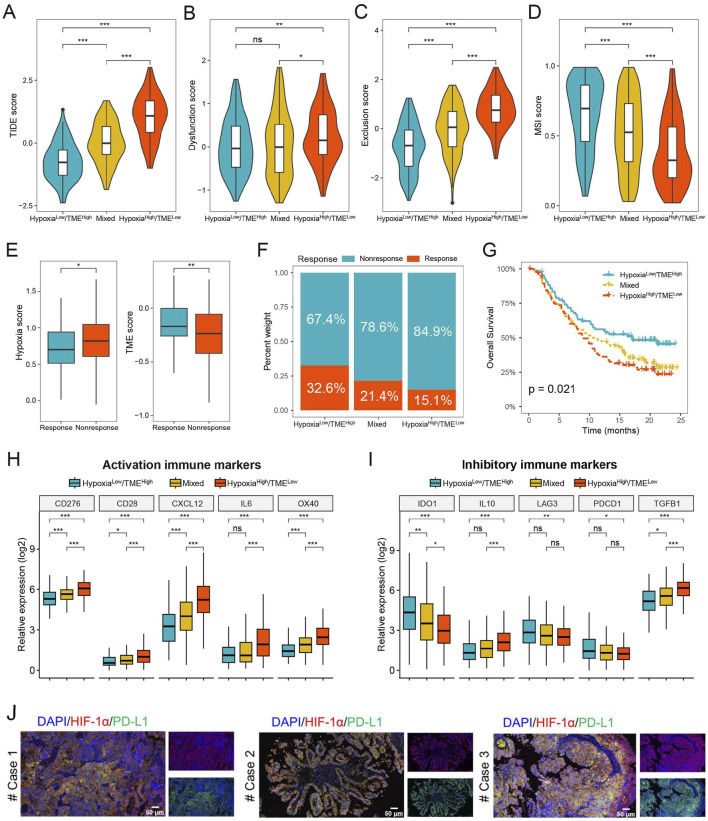
FIGURE 8.
Prediction of immunotherapy benefit based on Hypoxia-TME classifier. (A–D) TIDE, T-cell dysfunction and exclusion, and MSI score in different Hypoxia-TME subgroups. (E) Hypoxia and TME score in the IMvigor210 cohort. (F) The different percentages of anti-PD-L1 immunotherapy in different Hypoxia-TME subgroups. (G) Survival analysis of the Hypoxia-TME classifier in the IMvigor210 cohort. (H, I) The expression of activation and inhibitory immune markers in different Hypoxia-TME subgroups. (J) Immunofluorescence staining of HIF-1α and PD-L1 in HGSOC patients. *, p < 0.05; **, p < 0.01; ***, p < 0.001; ns, not significant.

