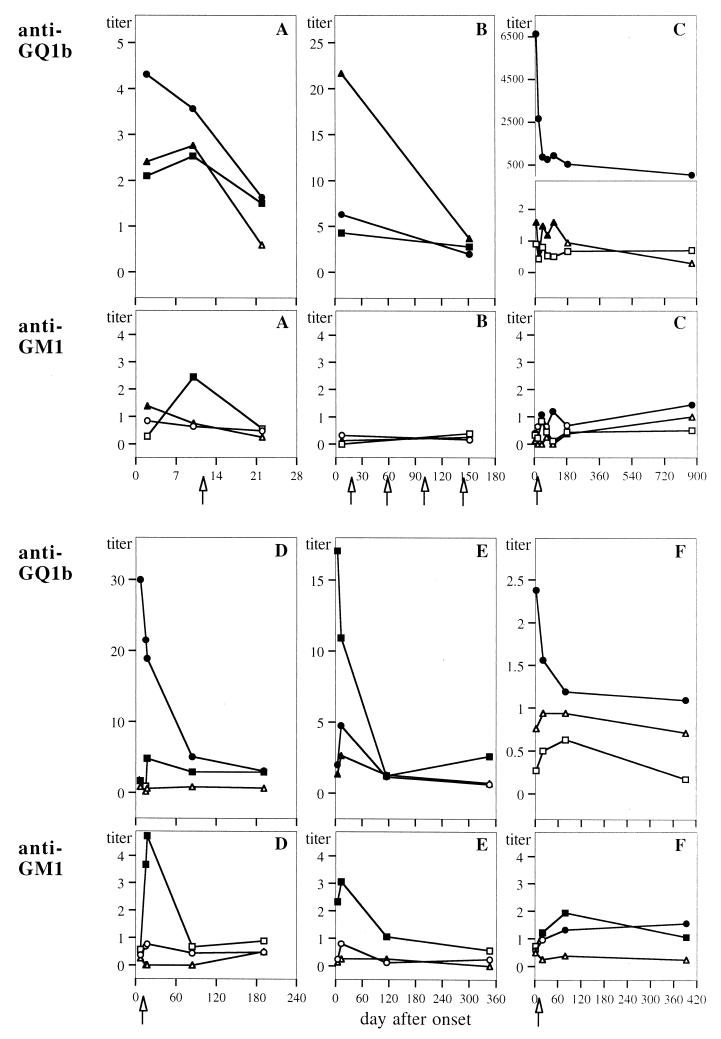
FIG. 2.
Antibody titers against GQ1b and GM1 during the course of disease in sera of six MFS patients (A to F). Each point represents a sequential sample, diluted 1:20 and 1:10 for anti-GQ1b and anti-GM1, respectively. Titers of the IgA class (triangles), IgG class (circles), and IgM class (squares) are given as ΔE/cutoff ratios; values above the corresponding cutoff are given as solid symbols, and those below the cutoff as given as open symbols. Cases shown in panels A, B, C, D, E, and F correspond to patients 5, 13, 12, 2, 10, and 6, respectively (see Table 3). Arrows indicate the time points of treatment with intravenous Ig (B, C, D, and F) or plasmapheresis (A).

