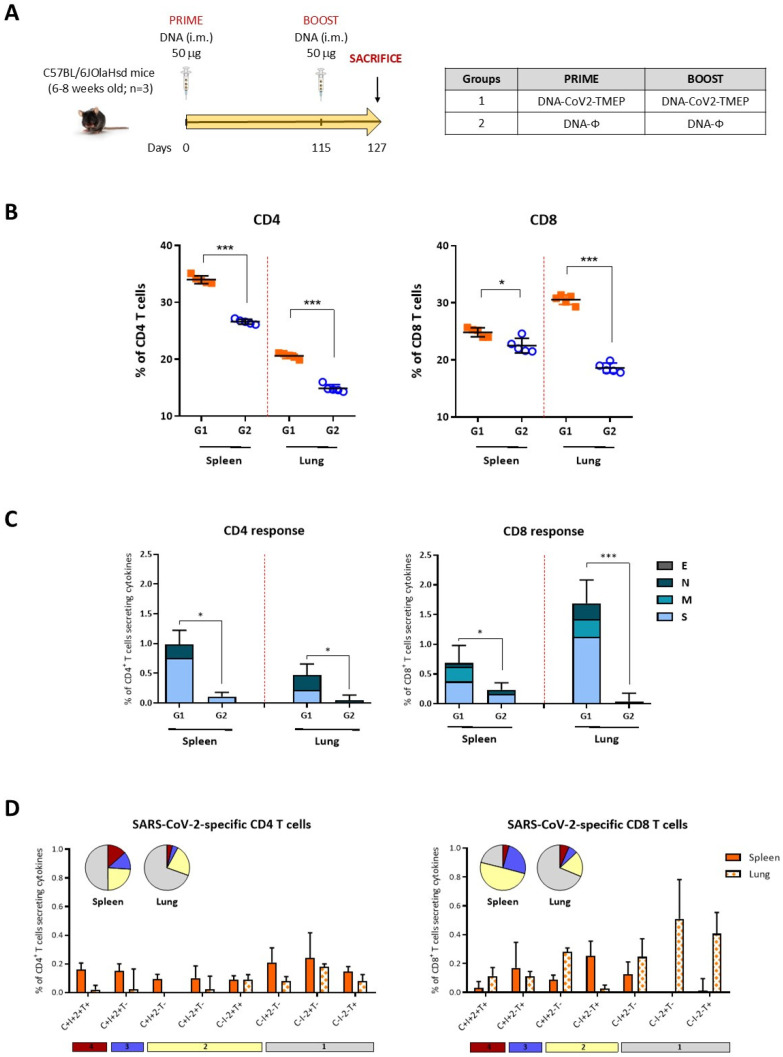
Figure 3.
SARS-CoV-2-specific T cell adaptive immune responses elicited by DNA-CoV2-TMEP in C57BL/6 mice when administered in homologous regimen. (A) Immunization schedule. Mice were inoculated with DNA-CoV2-TMEP or DNA-ϕ by i.m. route at days 0 and 115. At 12 days post-boost, animals were sacrificed, and spleens and lungs were harvested and processed for ICS assay, as described in the Materials and Methods section. (B) Magnitude of the total CD4 (left panel) or CD8 (right panel) T cells in the spleens and lungs of immunized mice. Each colored form represents the value obtained for each stimulus (S, M, N, E and RPMI). The 95% confidence interval (CI) is represented. (C) Magnitude of the total SARS-CoV-2-specific CD4 (left) or CD8 (right) T cells at 12 days post-boost after the stimulation of lymphocytes derived from spleen or lung with SARS-CoV-2 peptide pools. The total value of each group represents the sum of the percentages of SARS-CoV-2-specific CD4 or CD8 T cells expressing CD107a and/or producing IFN-γ and/or IL-2 and/or TNF-α against SARS-CoV-2 peptide pools. Data are background-subtracted. The 95% CI is represented. (D) Polyfunctional profile of the SARS-CoV-2-specific CD4 (left) or CD8 (right) T cells in DNA-CoV2-TEMP-immunized mice in spleen and lung. The positive combinations of the responses are indicated on the x axis, while the percentages of the functionally different cell populations within the total CD4 or CD8 T cells are represented on the y axis. Specific responses are grouped and color-coded based on the number of functions. All data are background-subtracted. The 95% CI is shown. C: CD107a; I: IFN-γ; 2: IL-2; T: TNF-α. *, p < 0.05; ***, p < 0.001.

