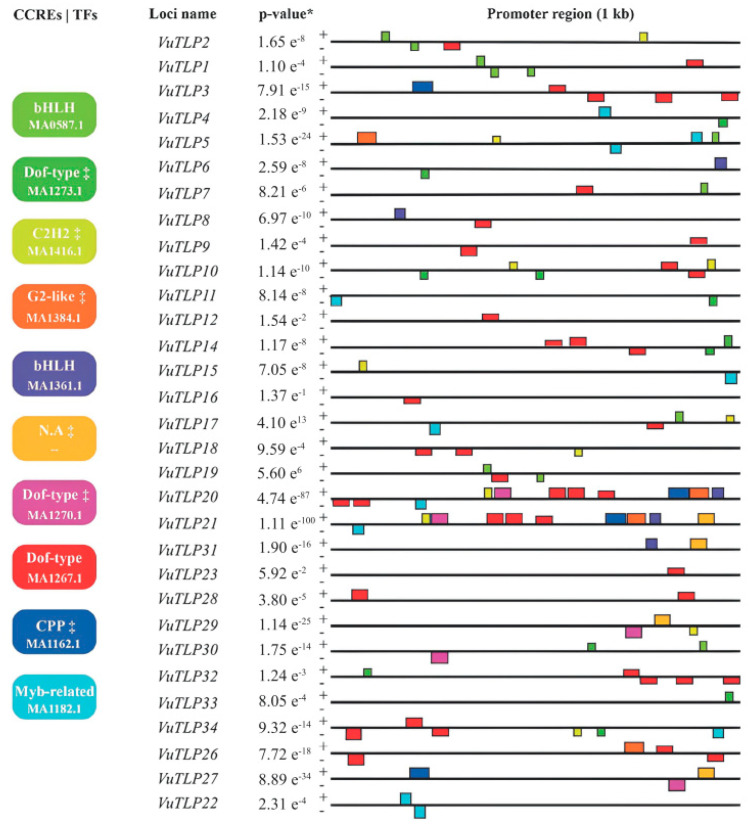
Figure 2.
Motif analysis of cis-regulatory elements (CCREs) detected in promoter regions of thaumatin-like protein coding genes. Promoter content and distribution represented by colored rectangles and squares. Colored boxes (CCREs|TFs section) bring information on transcription factors (TFs) associated with the identified motifs, as well as their respective JASPAR ID Matrix. “+” and “-” signals represent sense and antisense strands of the promoter regions analyzed. * MEME combined match p-value. ‡ Motifs with statistical significance below of the adopted cut-off (e-value < 10−2). N.A (not annotated motif).

