Figure 4.
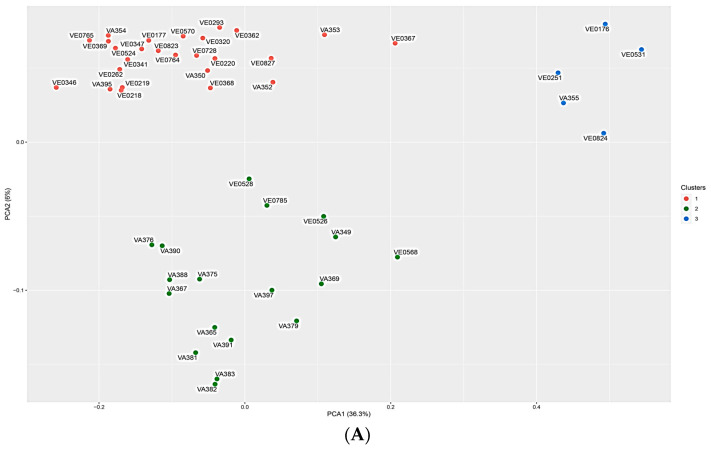
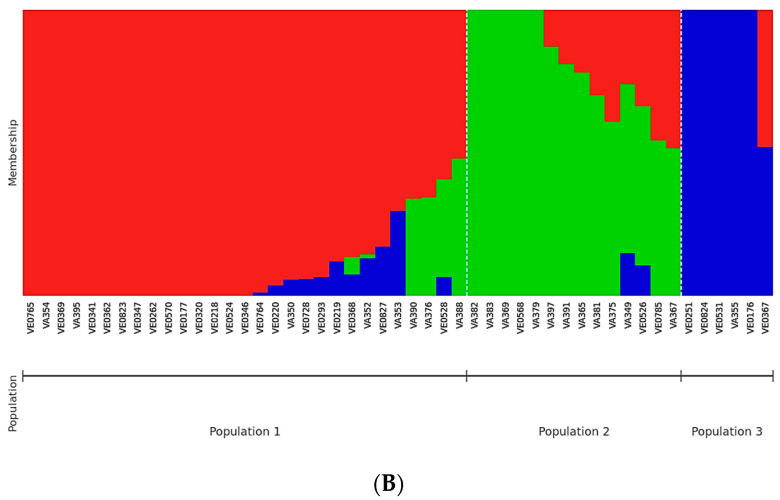
Unveiling the genetic diversity of maize landraces from the Lazio region using ddRADseq. (A) PCA based on the Prevosti distance of the similarity between the 50 samples. The three clusters are represented by different colors, with cluster 1 (red), cluster 2 (green), and cluster 3 (blue) grouping 26, 15, and 5 individuals, respectively. The outlier sample VE-0439 was removed. (B) Population structure inferred by STRUCTURE. A Distruct plot representing the admixture of populations with the number of expected populations set to 3 (K = 3) is shown. Each landrace is represented on the X-axis and visualized into K colors according to its membership coefficient.


