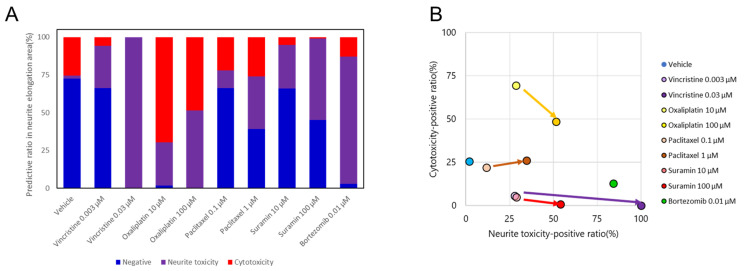
Figure 3.
Prediction results of selected compounds by morphological deep learning analysis. (A) Distribution of the predicted ratio as negative, positive for neurite toxicity, or positive for cytotoxicity. (B) Classification of selected compounds based on the prediction results. The predicted probability of each compound was plotted with cytotoxicity as the vertical axis and neurite toxicity as the horizontal axis.

