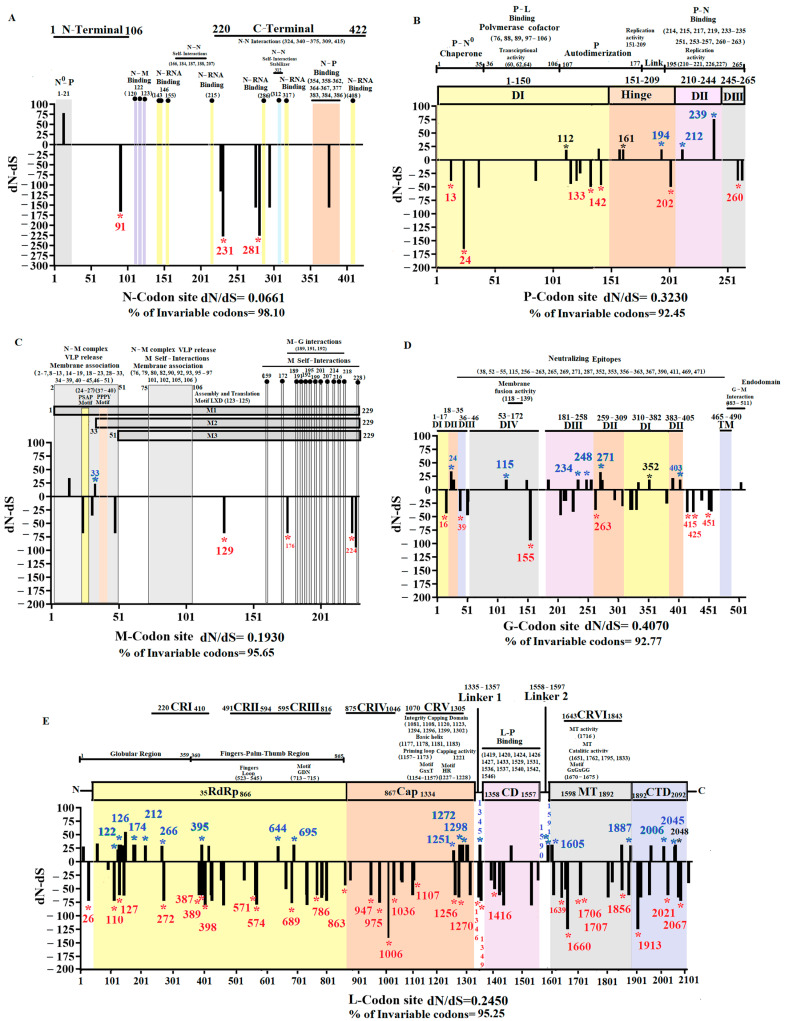
Figure 6.
Functional gene evolutionary dynamics of the epidemic VSIV lineage. Graphics represent the dN-dS ratios for specific codon sites at (A) Gene N (nucleoprotein), (B) Gene P (Phosphoprotein), (C) Gene M (Matrix protein), (D) Gene G (Glycoprotein), and (E) Gene L (Large polymerase). Analyses were conducted using SLAC. Codon sites under positive and purifying selection (identified by MEME and FEL) are highlighted at specific black bars with green and red asterisks, respectively. Similarly, the specific gene location of these codons is indicated by blue and red numbers. Bars highlighted by black asterisks and numbers indicate codon sites identified as relevant by the Metadata-driven comparative analysis but evolving under neutrality based on MEME and FEL analyses. Information about functional sites, relevant motifs, and residues encoded by multiple codon sites at different genes are also indicated. Numbers in parentheses indicate codon positions linked with key residues associated with diverse functions in the viral proteome. The information about functional sites at different viral proteins was obtained from the following publications: Nucleoprotein [45,46,51,52,53], Phosphoprotein [54,55,56,57,58,59,60], Matrix protein [47,49,61,62,63], Glycoprotein [50,64,65,66,67,68,69], and Polymerase [70,71,72,73,74].

