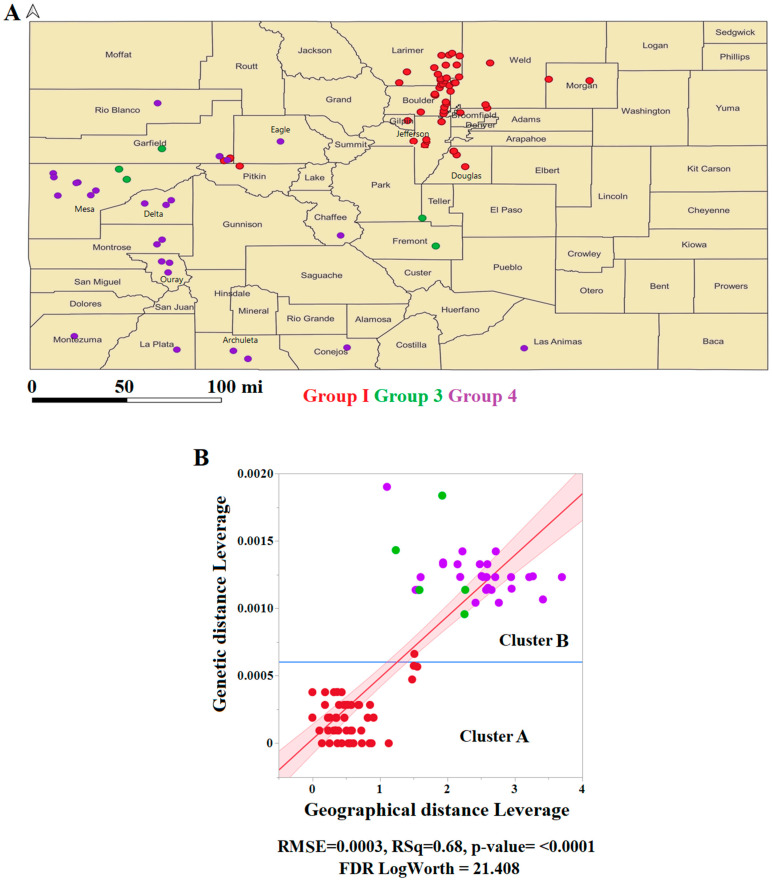
Figure 7.
Correlation between genetic and geographical distances using the Colorado dataset as a model. (A) Geographical distribution showing counties where isolates belonging to different genetic groups were recovered from naturally infected equine samples in Colorado during 2019. The map was developed using the software QGIS (https://www.qgis.org/en/site/). (B) ANOVA analysis was used as an exploratory method to predict the correlation between genetic and geographical distances. RMSE denotes the root mean square error of the model, while RSq indicates the square of the correlation coefficient, and the FDR Log Worth shows the probability that the correlation between variables was caused by chance, with values higher than 2 indicating dependency between variables.

