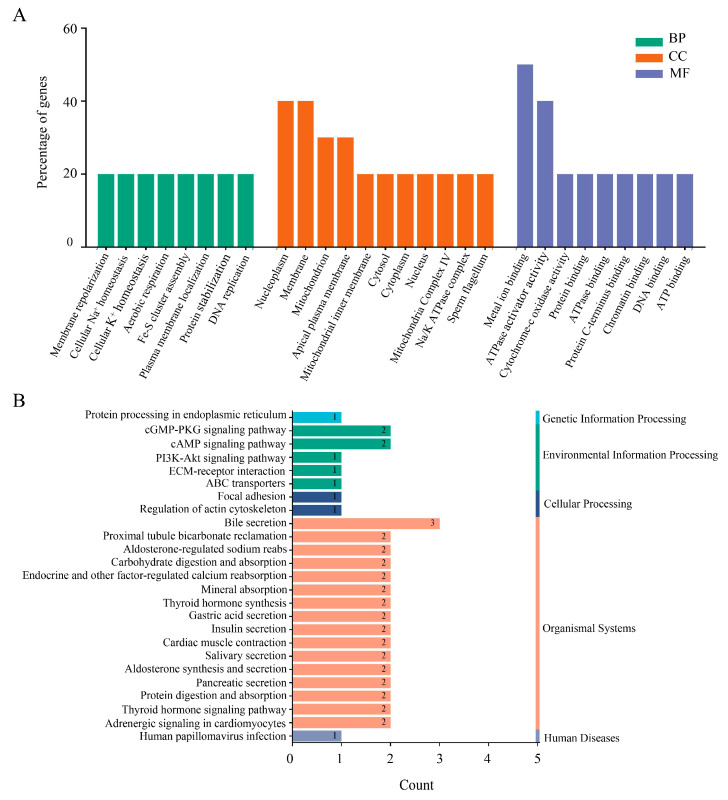
Figure 5.
GO and KEGG pathway analysis of host proteins interacting with Nsp2. (A) GO enrichment analysis. BP, biological process; CC, cellular component; MF, molecular function. The horizontal axis represents GO functional categories and the vertical axis shows gene percentages. (B) KEGG pathway enrichment analysis. The horizontal axis represents the number of genes, and the vertical axis represents the pathway categories.

