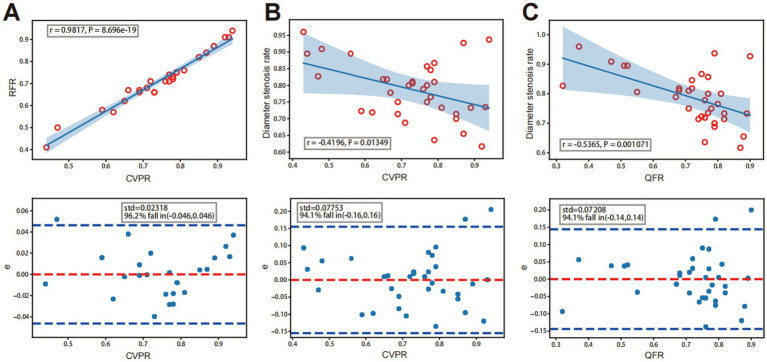
Figure 4.
A strong, positive correlation between CVPR and RFR. Analysis diagram of a linear correlation is in the figure above, and the figure below is the residual error diagram. (A) Correlation between QFR or CVPR and diameter stenosis rate. (B) A weekly negative correlation between CVPR and DS%. (C) Medium negative correlation between QFR and DS%.

