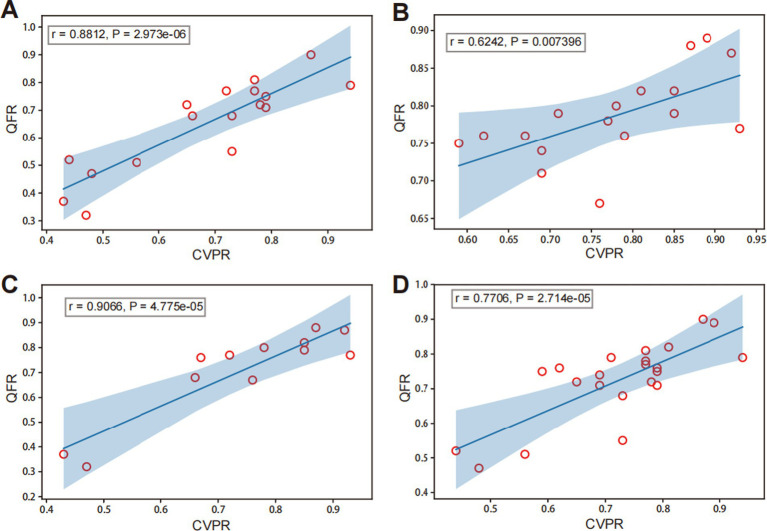
Figure 5.
Correlation analysis of QFR and CVPR among different subgroups. Panels (A) and (B) present different degrees of diameter stenosis (DS): (A) DS% >80 and (B) DS% ≤80%. Panels (C) and (D) represent different lesions: (C) the anterior circulation (middle cerebral artery and internal carotid artery in intracranial segment) and (D) posterior circulation (basilar artery and vertebral artery in intracranial segment).

