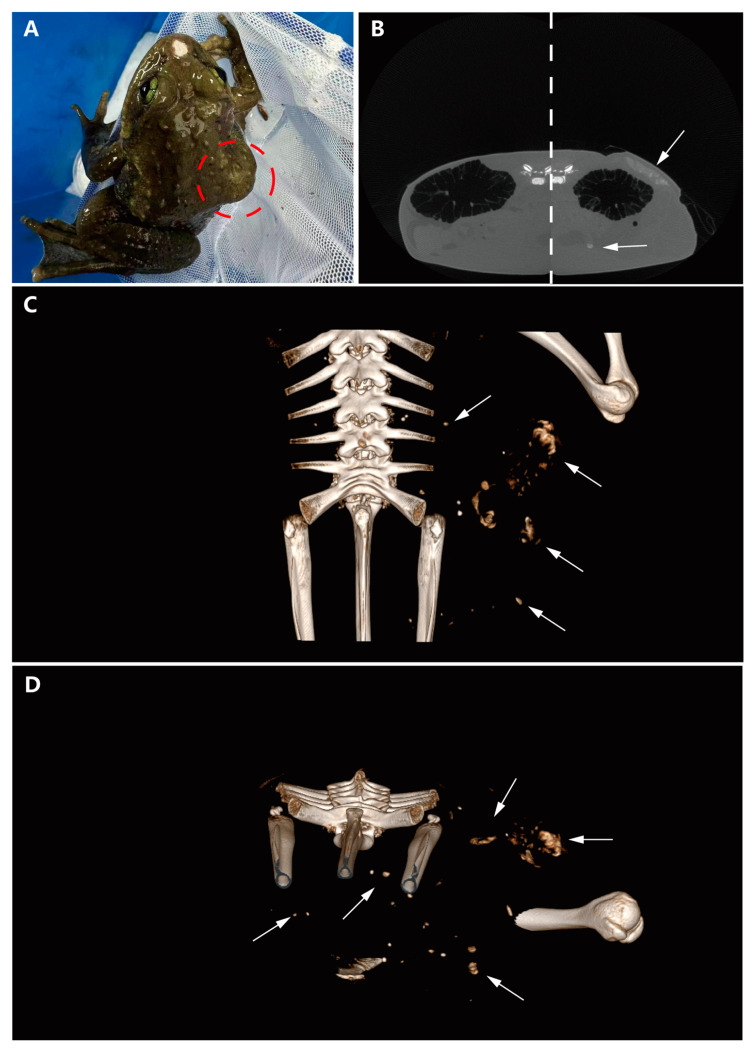
Figure 1.
Gross examination and micro-CT scan results. (A) Subcutaneous mass visible in the red circle on the right dorsoventral surface. (B) CT scan comparison between the diseased and healthy sides (the image is composed of two control images spliced with dotted lines, with white arrows indicating the tumor location). (C) 3D model illustrating the spatial relationships of the mass (arrows indicating the tumor). (D) Horizontal cross-section of the body cavity revealing dispersed nodular masses (arrows indicating the tumor).

