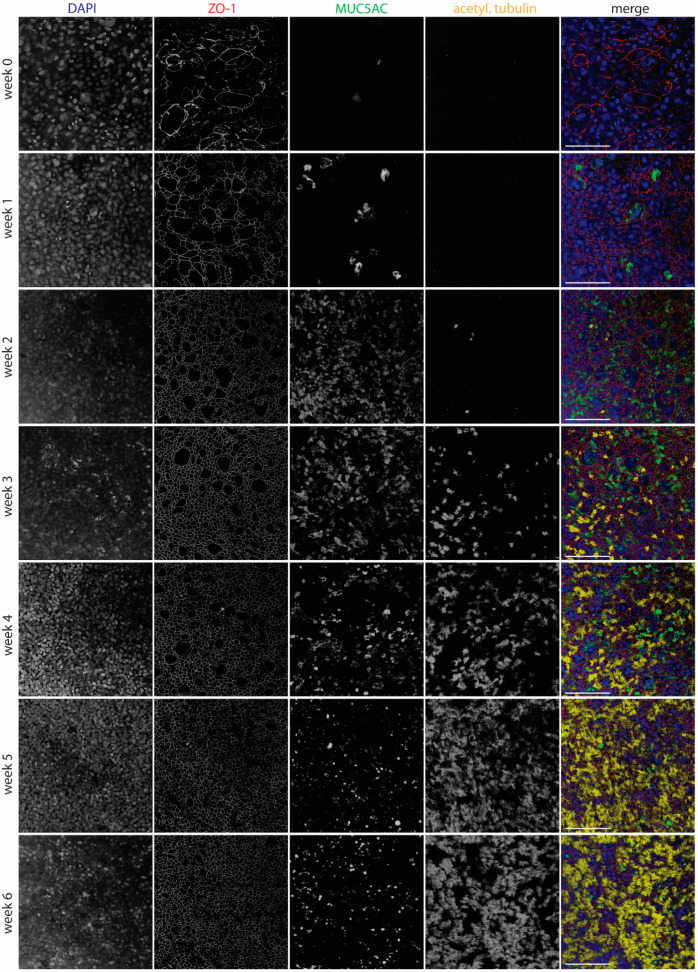
Figure 2.
Development of WD-AECs over time. Confocal laser scanning microscopy images showing the development of tight junctions (ZO-1), goblet cells (Muc5ac) and cilia (acetylated tubulin) over the course of 6 weeks after airlifting Transwell filters. Goblet cells were most abundant at 2–4 weeks, while cilia appeared after 3 weeks. Tight junctions were detected from week 0 onwards, but only started to show a regular pattern from week 2 onwards. Merged images show nuclei in blue, tight junctions in red, goblet cells in green and cilia in yellow. Scale bar represents 100 µm. 40× objective. Representative data from one experiment are shown.

