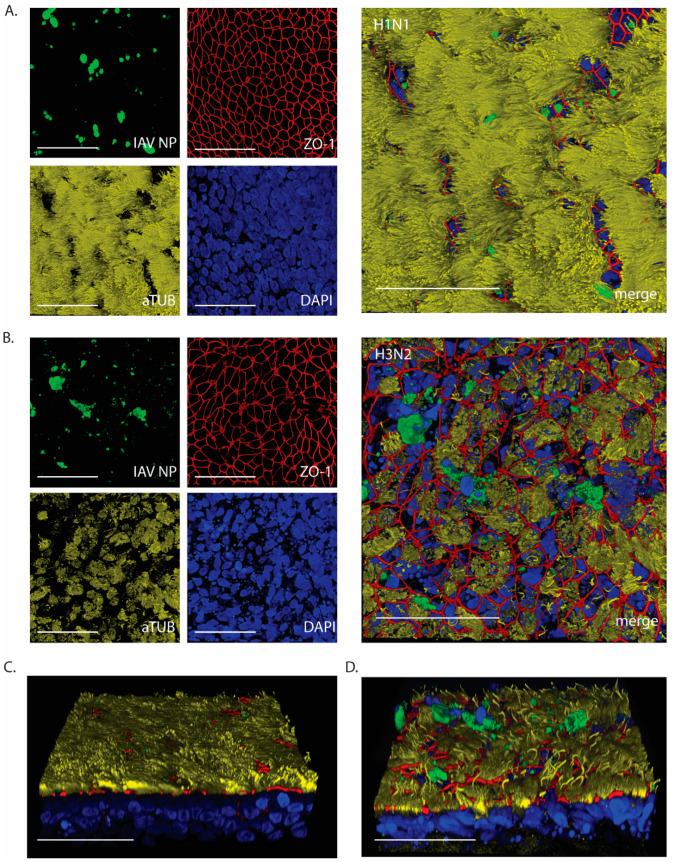
Figure 4.
IAV NP expression after 24 h post-infection with 103 TCID50. Confocal microscopy images to visualize expression of IAV NP and epithelial composition. (A) H1N1-inoculated WD-AECs showed NP expression (green), continuous tight junctions (red), a thick layer of cilia (yellow) and predominantly intact nuclei (blue). (B) H3N2-inoculated filters showed NP expression while at the same time tight junctions were compromised, cilia expression was reduced and more fragmented nuclei were visible. (C) Angled side-view of WD-AEC shown in (A). (D) Angled side-view of WD-AEC shown in (B). Note that IAV NP staining (green) is visible within or above the apical side of WD-AEC cultures. All images: Scale bar represents 50 µm. 100× objective. Representative data from one experiment are shown.

