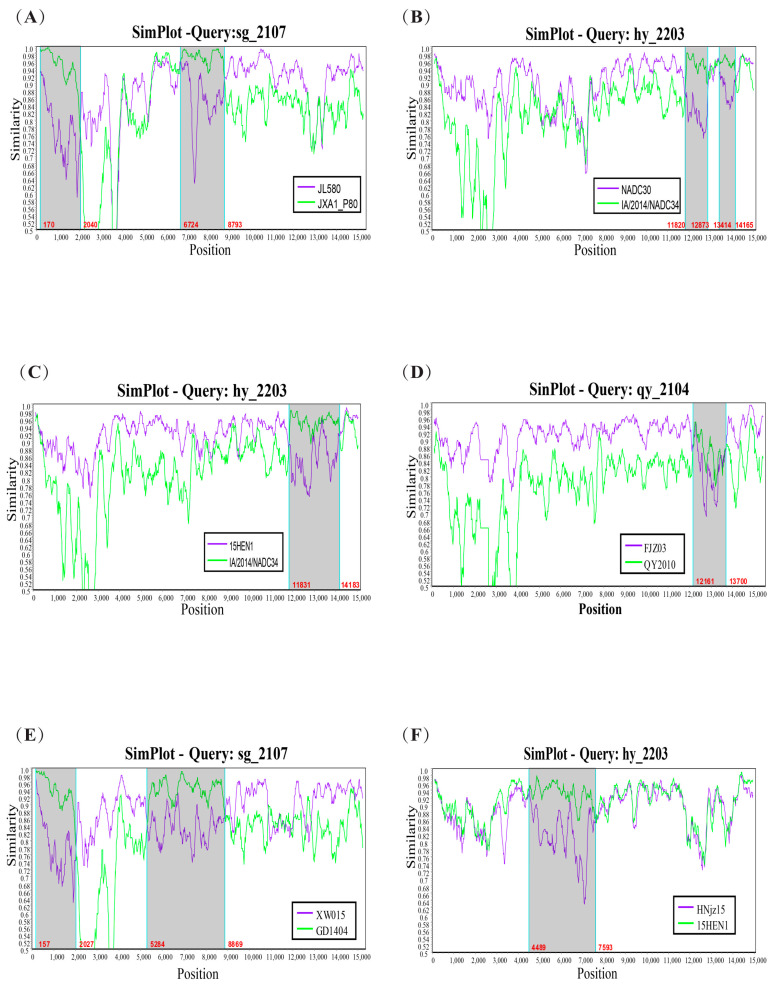
Figure 9.
SimPlot recombination analysis graphs of the full genome of the sequences of the PRRSV strains obtained in this study, where the gray area indicates the position of gene recombination. (A–F): SimPlot recombination analysis graphs corresponding to recombination events 1, 2, 3, 4, 5, and 8 in Table S16.

