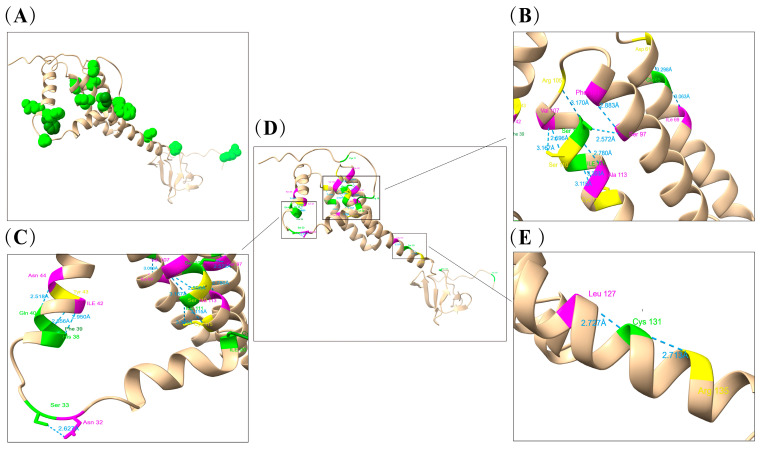
Figure 11.
PRRSV GP5 protein model construction and visualization analysis of positively selected sites. The identified sites are presented as light green or dark green spheres. (A) Cartoon representation of the PRRSV GP5 protein monomer, site 203 was not displayed; (B,C,E): Microscopic display of positively selected sites and their hydrogen bonds on the GP5 protein model; (D) Overall display of the GP5 protein model and its positively selected sites.

