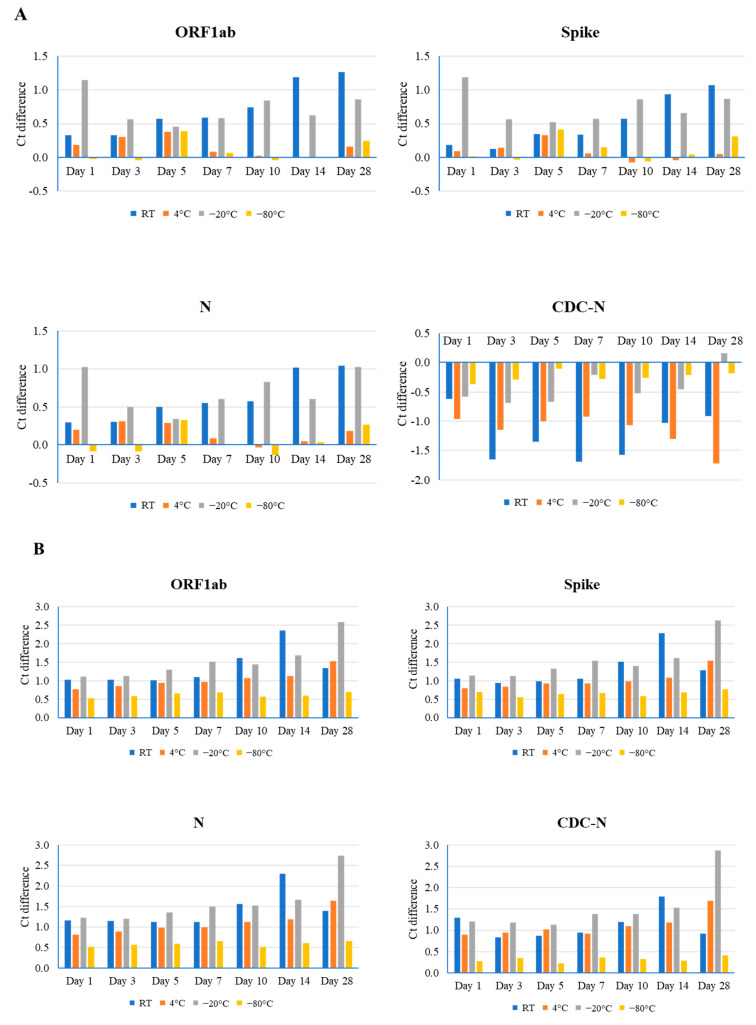
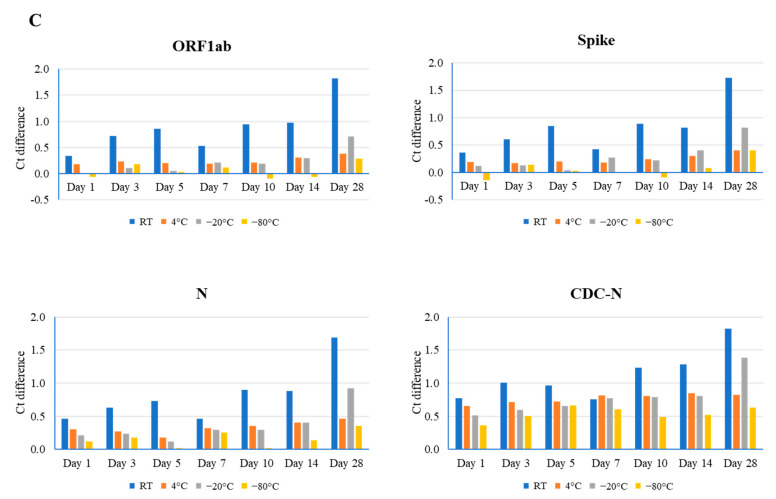
Figure 1.
Comparison of different time point (days 1, 3, 5, 7, 10, 14, and 28) and temperature (room temperature (RT), 4 °C, −20 °C, and −80 °C) effects on the stability of the SARS-CoV-2 genome, as determined by real-time RT-PCR using the TaqPath Combo SARS-CoV-2 kit (ORF1ab, spike, and N) and CDC-based SARS-CoV-2 N1 (CDC-N). Ct difference indicates the value above or below the reference Ct at day 0 for that sample. Three clinical samples with high ((A), Ct value 20), medium ((B), Ct value 24), and low ((C), Ct value 28) Ct values were evaluated.


