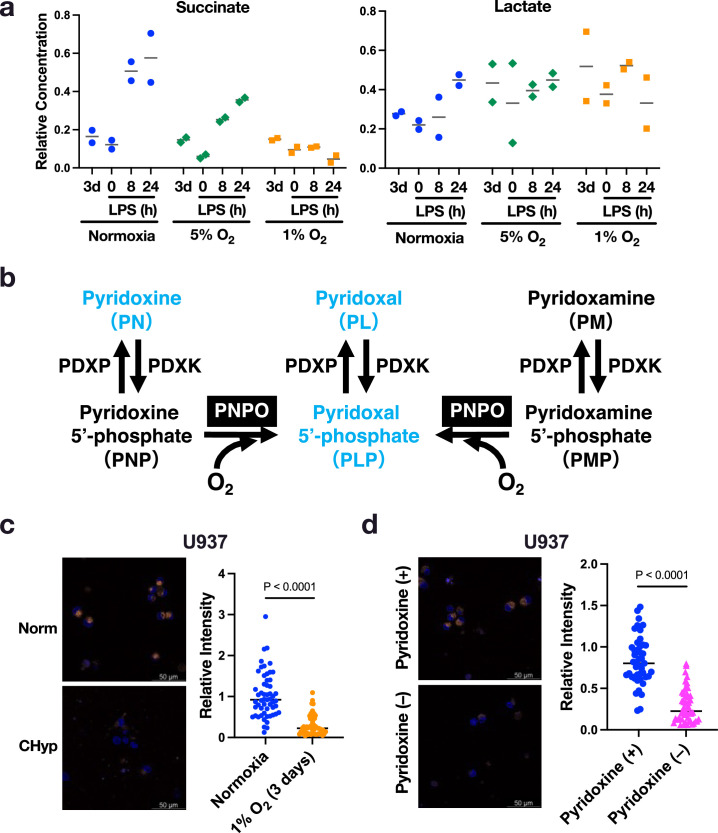
Extended Data Fig. 6. Metabolite changes induced by prolonged hypoxia and its effect on lysosomal activity.
a. Relative amounts of cellular succinate and lactate in the BMDMs differentiated and stimulated with LPS under normoxia, 5% O2 and 1% O2 (n = 2). The metabolites were also measured on day 3 of differentiation. b. Schematic illustration indicating vitamin B6 metabolism and catalysing enzymes. PDXP: pyridoxal phosphatase, PDXK: pyridoxal kinase, PNPO: pyridoxine 5’-phosphate oxidase. c, d. Lysosomal acidification in PMA-treated U937 cells under different oxygen tension (c) and with or without pyridoxine in the culture medium (d). Scale bars correspond to 50 μm. Representative AcidiFluor ORANGE staining (left) and its quantification (right). Two-sided Student’s t-test was conducted to evaluate statistical significance. A representative result from 3 independent experiments is shown for each.

