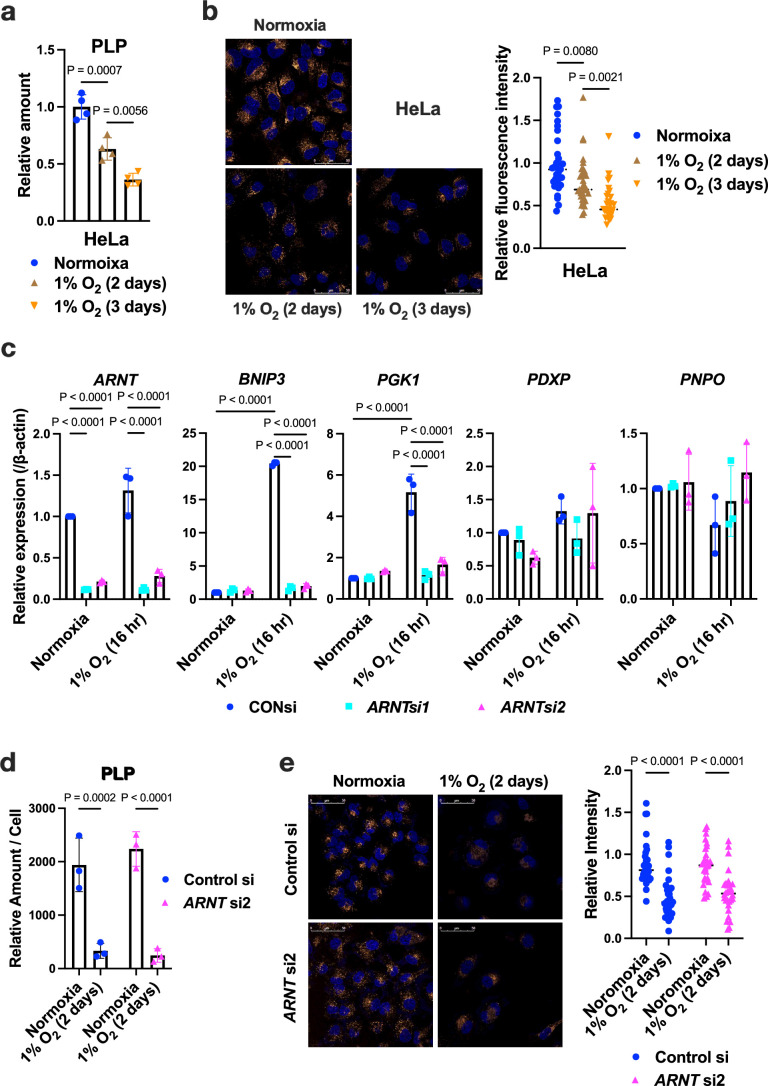
Extended Data Fig. 7. Impact of prolonged hypoxia on PLP levels and lysosomal acidification in HeLa cells.
a. PLP levels in HeLa cells in normoxia and hypoxia for 2 and 3 days (n = 4 biologically independent samples). b. Lysosomal acidification in HeLa cells. Representative AcidiFluor ORANGE staining (left) and its quantification (right). A representative result from 3 independent experiments is shown. c. Gene expression in HeLa cells with or without ARNT knockdown in normoxia and hypoxia for 16 hours (n = 3). d. PLP levels in HeLa cells with or without ARNT knockdown in normoxia and hypoxia for 2 days (n = 3). e. Lysosomal acidification in HeLa cells with or without ARNT knockdown. Representative AcidiFluor ORANGE staining (left) and its quantification (right) from 3 independent experiments. Scale bars correspond to 50 μm (b, e). Error bars represent S.E.M. (a, c, d). One-way ANOVA (a, b) and two-way ANOVA (c-e) were conducted to evaluate statistical significance.

