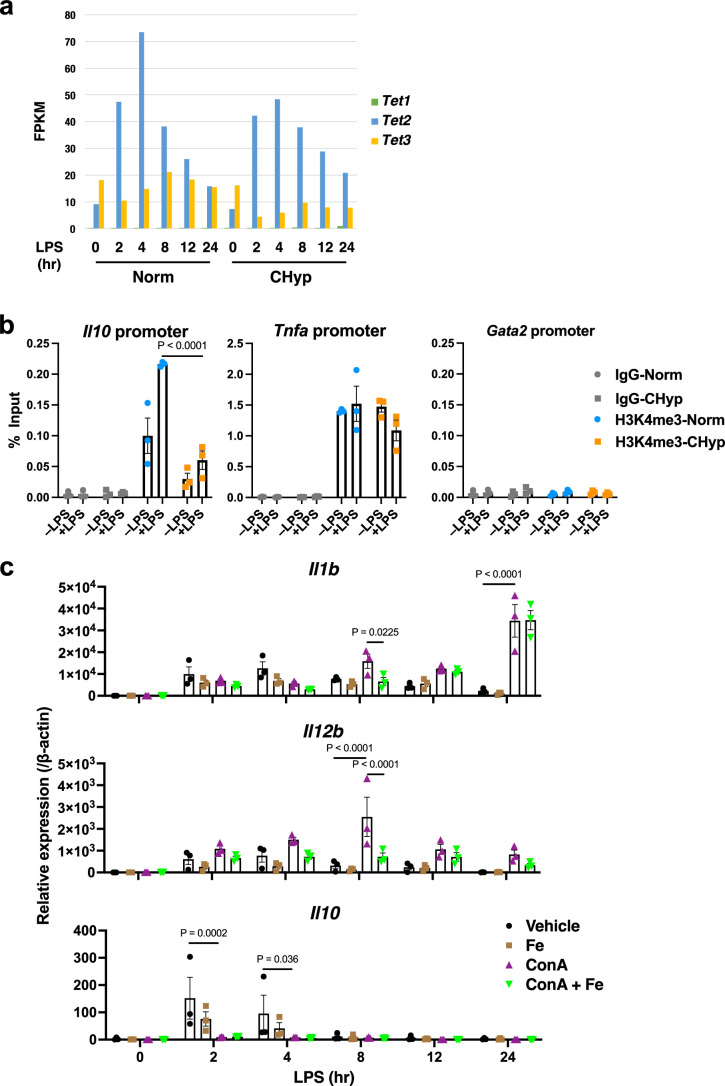
Extended Data Fig. 8. LPS-induced gene expression and H3K4 trimethylation in BMDM.
a. FPKM values of Tet1, Tet2 and Tet3 expression obtained from the RNA-seq analysis. Norm: BMDMs differentiated and stimulated with LPS under normoxia, CHyp: BMDMs differentiated and stimulated with LPS under 1% O2. b. H3K4me3 deposition at the Il10 promoter and Tnfa promoter in BMDMs treated with or without LPS for 12 h (n = 3). The Gata2 promoter was evaluated as a negative control locus. c. Expression of cytokine genes in BMDMs after LPS stimulation (n = 3). BMDMs differentiated under normoxia were treated with 10 nM ConA or vehicle (DMSO) with or without 0.1 mg/ml ferric ammonium citrate at 16 h before LPS stimulation. Error bars represent S.E.M. (b, c). Two-way ANOVA was conducted to evaluate statistical significance (b, c).

