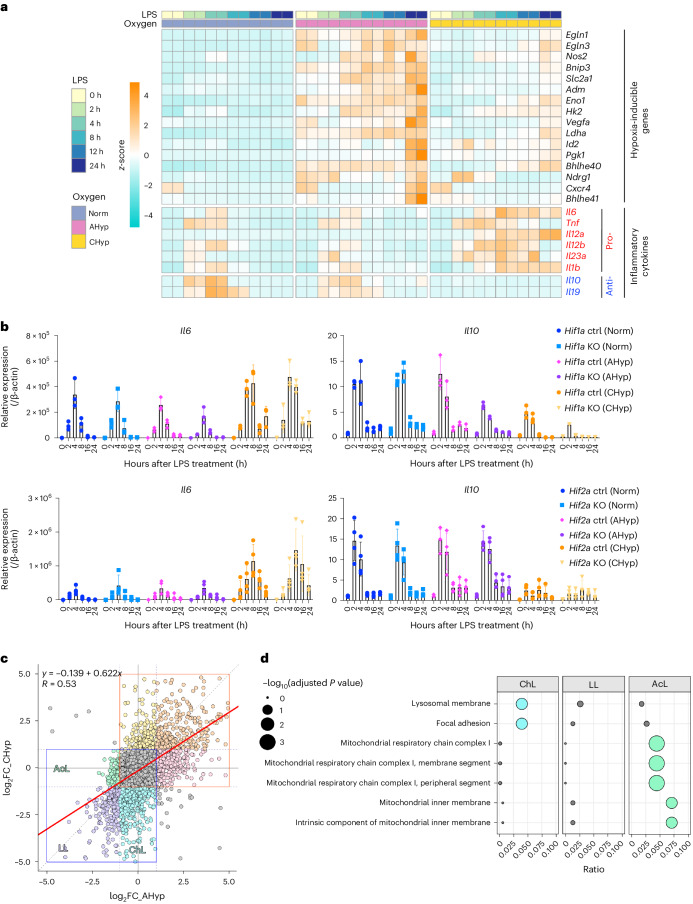
Fig. 2. Prolonged hypoxia augments the proinflammatory response of BMDMs.
a, A heatmap illustrating RNA-seq data of representative HIF target genes and cytokine genes in BMDMs after LPS stimulation. Norm, BMDMs differentiated and stimulated with LPS under normoxia; AHyp, BMDMs differentiated under normoxia and stimulated with LPS under 1% oxygen; CHyp, BMDMs differentiated and stimulated with LPS under 1% oxygen. b, Expression of cytokine genes in BMDMs (n = 3 biologically independent samples). Norm, AHyp and CHyp BMDMs generated from Hif1a mutant mice and Hif2a mutant mice were examined. Error bars represent s.e.m. Ctrl, control; KO, knockout. c, Scatter-plots showing a correlation of gene expression fold change (FC) by prolonged and acute hypoxia in BMDMs. A horizontal axis indicates log2 FC of CHyp versus Norm and a vertical axis indicates log2 FC of AHyp versus Norm. Areas enclosed by red and blue squares are those containing upregulated and downregulated genes, respectively. The strength of the correlation was evaluated with a Pearson product-moment correlation coefficient. d, Enrichr analysis (Gene Ontology (GO)_Cellular_Component_2017b) of downregulated genes. ChL, LL and AcL indicate gene groups specifically downregulated in CHyp BMDMs, commonly downregulated in CHyp and AHyp BMDMs and specifically downregulated in AHyp BMDMs, respectively, compared with Norm BMDMs after the LPS treatment (indicated in c). Circle sizes indicate adjusted P values from multiple comparisons and circle colours indicate statistical significance (blue and green, adjusted P value < 0.05; grey, not significant).

