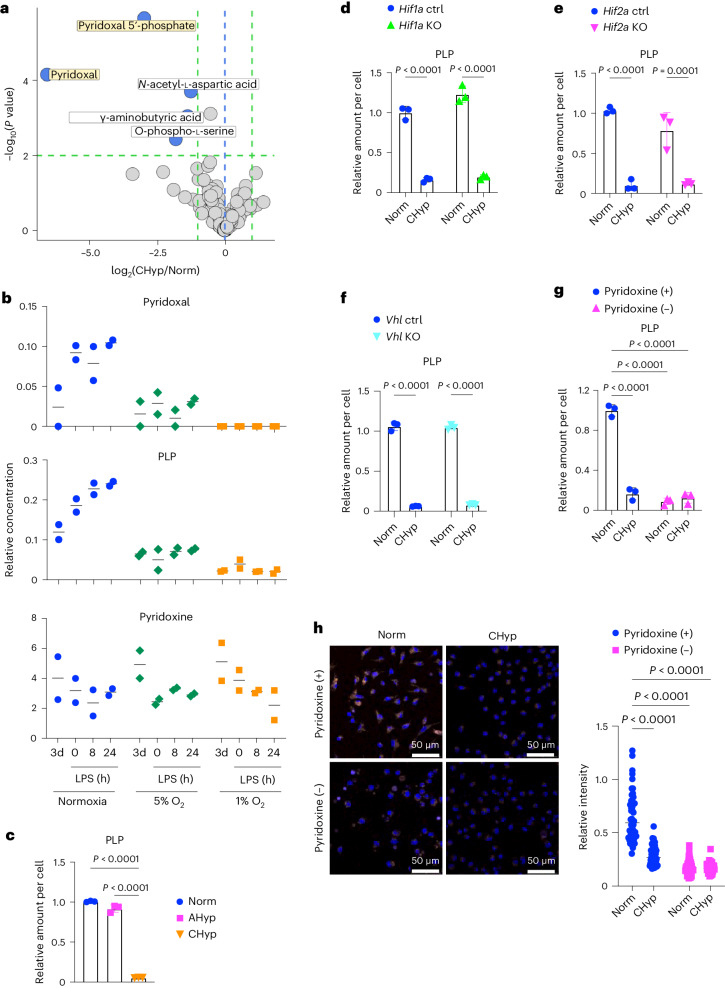
Fig. 4. Prolonged hypoxia reduces PLP.
a, Volcano plot showing metabolome comparison between CHyp BMDMs and Norm BMDMs. A horizontal dashed line indicates a significance threshold (P = 0.01) and green vertical dashed lines indicate levels of twofold increase and decrease. The blue vertical dashed line indicates the level at which CHyp and Norm are equal. A two-sided Welch’s t-test was conducted for calculating P values. b, Relative amounts of pyridoxal, PLP and pyridoxine in BMDMs differentiated and stimulated with LPS under normoxia, 5% and 1% oxygen (n = 2 biologically independent samples). The metabolites were also measured on day 3 of differentiation. c–g, Relative amount of PLP in Norm BMDM, AHyp BMDM and CHyp BMDM (c) and Norm BMDM and CHyp BMDM generated from Hif1a mutant mice (d), Hif2a mutant mice (e), Vhl mutant mice (f) and Norm BMDM and CHyp BMDM with or without pyridoxine in the culture medium (g) (n = 3 biologically independent samples for each experiment). Error bars represent s.e.m. h, Lysosomal acidification in Norm BMDMs and CHyp BMDMs with or without pyridoxine in the culture medium. Scale bars, 50 μm. Representative AcidiFluor ORANGE staining (left) and its quantification (right) from three independent experiments. A two-way ANOVA (d–h) and one-way ANOVA (c) were conducted to evaluate statistical significance.

