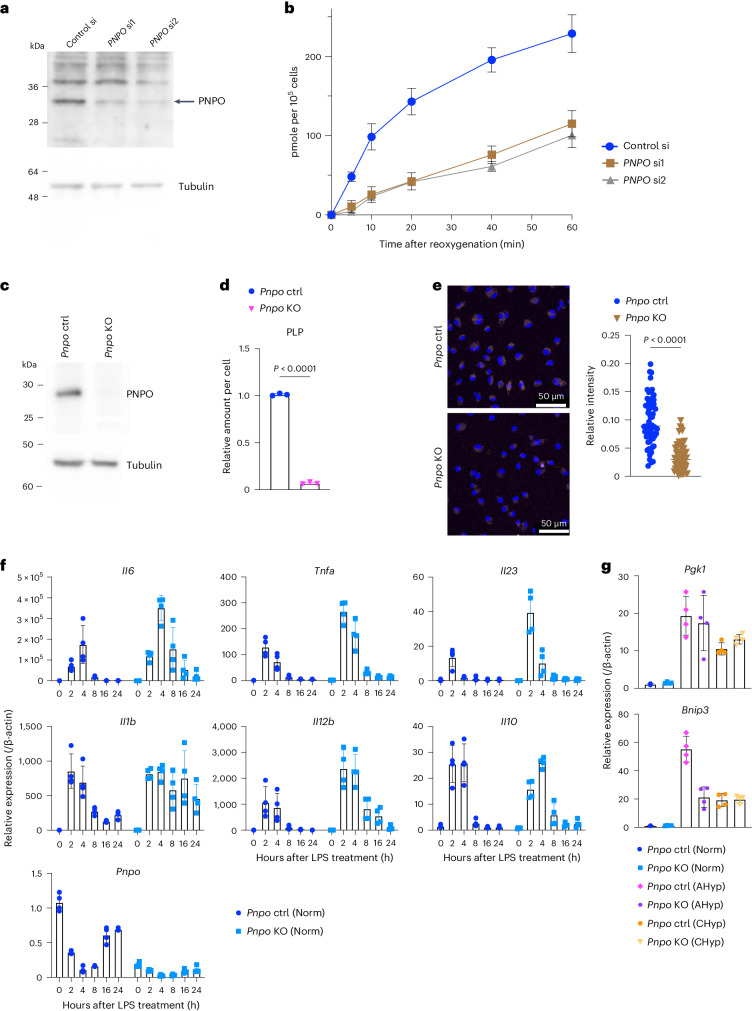
Fig. 5. PNPO generates PLP in response to oxygen.
a, Immunoblot analysis detecting PNPO in U937 cells treated with PNPO siRNAs or control siRNA. Tubulin was detected as a loading control. A representative result from three independent experiments is shown. b, PLP increase in U937 cells pre-exposed to 1% oxygen. PLP quantity upon reoxygenation is plotted (n = 3 biologically independent samples for each experiment). c, Immunoblot analysis detecting PNPO protein in BMDM generated from Pnpo mutant mice. A representative result from two independent experiments is shown. d, PLP levels in Pnpo-deficient Norm BMDMs (n = 3 biologically independent samples). e, Lysosomal acidification in Pnpo-deficient Norm BMDMs. Scale bars, 50 μm. Representative AcidiFluor ORANGE staining (left) and its quantification (right) from three independent experiments. f,g, Gene expression in response to LPS in normoxia (f) and in response to acute and chronic hypoxia without LPS (g) in Pnpo-deficient BMDMs (n = 4 biologically independent samples). Error bars represent s.e.m. (b,d,f,g). A two-sided Student’s t-test (d,e) was conducted to evaluate statistical significance.

