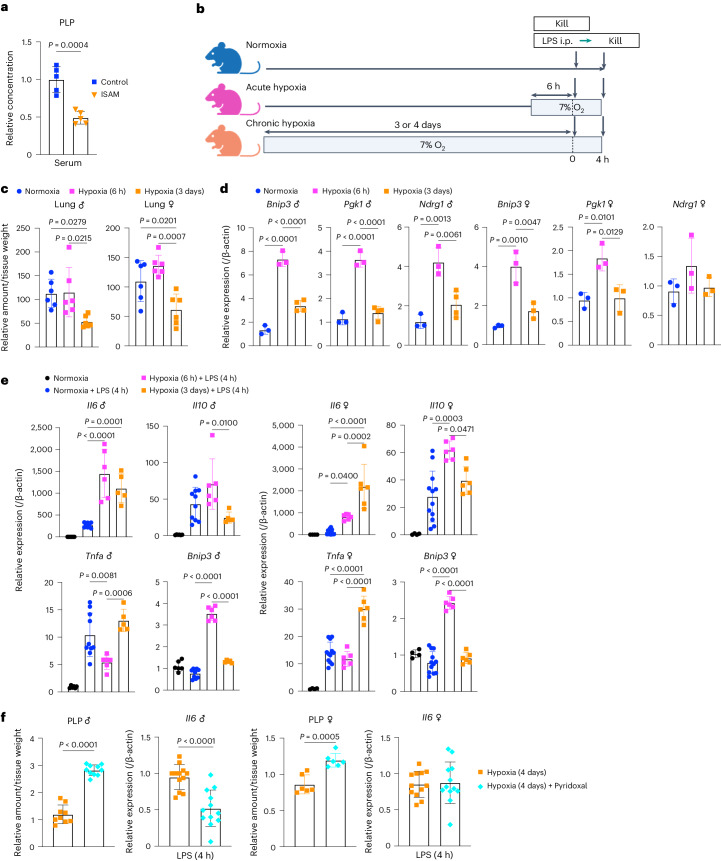
Fig. 8. In vivo contribution of PNPO–PLP axis in prolonged hypoxia.
a,c, Relative amount of PLP in serum of male ISAM and control mice (n = 5 mice for each group) (a) and lung tissues of mice exposed to acute (6 h) and chronic hypoxia (3 days) (n = 6 mice for each group) (c). b, Experimental design for exposure of mice to hypoxia. The illustration was created with BioRender.com. i.p., intraperitoneally. d, Expression of HIF target genes in lung tissues of mice exposed to acute (6 h) and chronic hypoxia (3 days) (n = 3 or 4 mice for each group). e, Gene expression at 4 h after LPS treatment in lung tissues (n = 5–10 for male, n = 4–12 for female). f, Pyridoxal supplementation to mice exposed to chronic hypoxia (4 days). Relative amount of PLP in lung tissues (n = 9–10 for male and n = 6 for female) and Il6 expression at 4 h after LPS treatment in lung tissues (n = 12 for male and female) are shown. Error bars represent s.e.m. (a,c–f). A two-sided Student’s t-test (a,f) and one-way ANOVA (c–e) were conducted to evaluate statistical significance.

