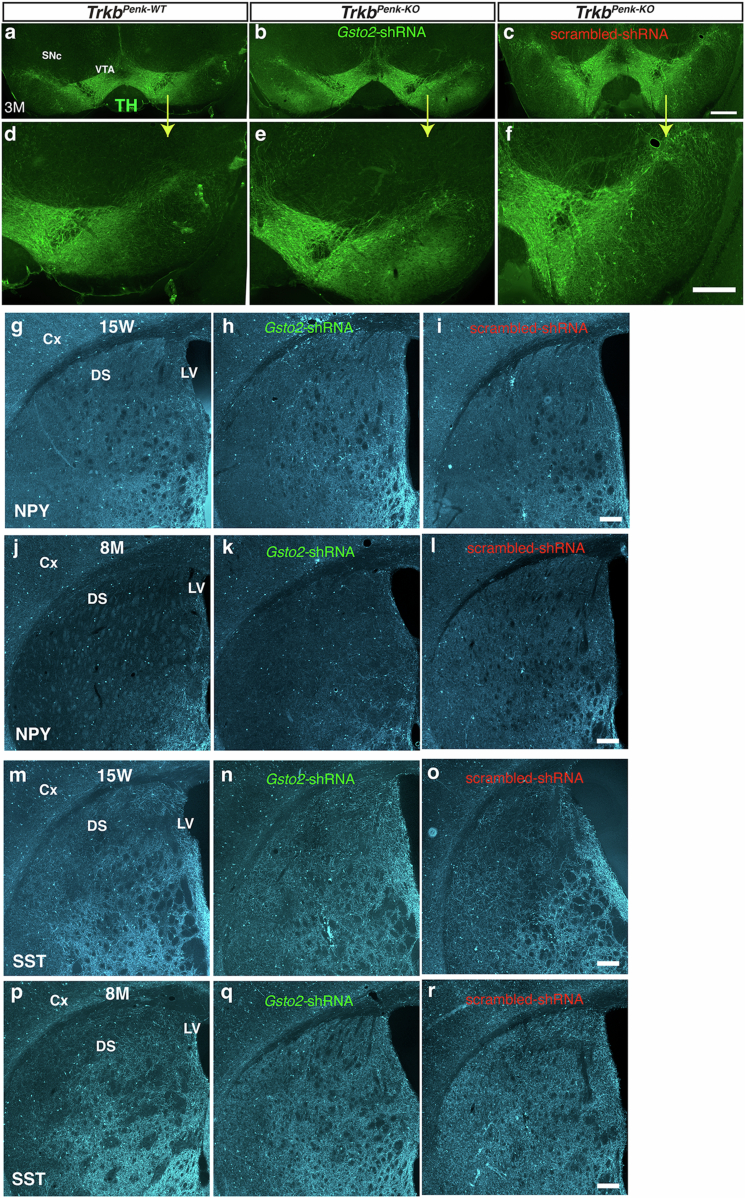
Extended Data Fig. 9. Gsto2-shRNA striatal injection rescues the dopaminergic dysfunction and NPY/SST expression.
a–c) Representative images of TH immunofluorescence of the whole SNc/VTA brain region from TrkbPenk-WT control (a), TrkbPenk-KO mutant injected with Gsto2-shRNA (b) or scrambled-shRNA (c) in the striatum at 3 M. d–f) shows a higher magnification of one side (as indicated by the arrow) of the SNc/VTA images in panels (a–c). g–i) Representative whole dorsal striatal images of NPY immunofluorescence from TrkbPenk-WT control (g), TrkbPenk-KO mutant injected at 3 M with Gsto2-shRNA (h) or scrambled-shRNA in the striatum (i) and analysed at 15 W. j–l) Representative whole dorsal striatal images of NPY immunofluorescence from TrkbPenk-WT control (j), TrkbPenk-KO mutant injected at 3 M with Gsto2-shRNA (k) or scrambled-shRNA (l) in the striatum and analysed at 8 M. m–o) Representative whole dorsal striatal images of SST immunofluorescence from TrkbPenk-WT control (m), TrkbPenk-KO mutant injected at 3 M with Gsto2-shRNA (n) or scrambled-shRNA in the striatum (o) and analysed at 15 W. p–r) Representative whole dorsal striatal images of SST immunofluorescence from TrkbPenk-WT control (p), TrkbPenk-KO mutant injected at 3 M with Gsto2-shRNA (q) or scrambled-shRNA (r) in the striatum and analysed at 8 M. Scale bars, c, 400μm; f, 300μm. i, l, o and r, 200μm. Related to Fig. 7, the images presented here are from cohorts used in Fig. 7a–f, i–r (n = 3 for each genotype, male mice). These experiments were repeated on additional cohorts, yielding similar results.

