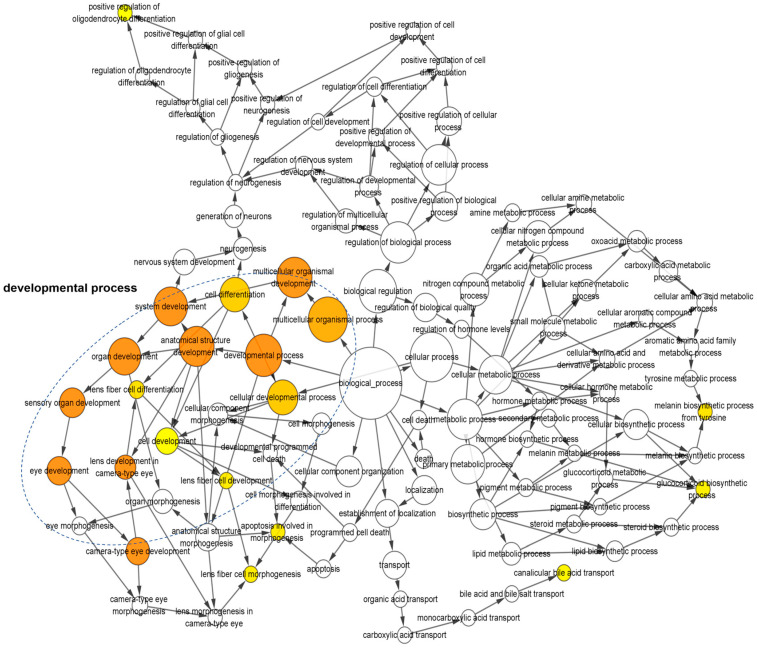
Figure 6.
The gene ontology network of the enriched biological process based on the DEGs from the c-Flip+/− fetal heads compared with the WT fetal heads of the fetuses delivered by ZIKV-infected WT dams in the sub network is displayed using the BinGO plug-in for Cytoscape. The color depth of nodes refers to the corrected p-value of the ontologies. The yellow color indicates the highly enriched processes. The deeper color indicates a higher degree of enrichment. The size of the nodes refers to the number of genes that are involved in the ontologies. The larger size indicates more genes.

