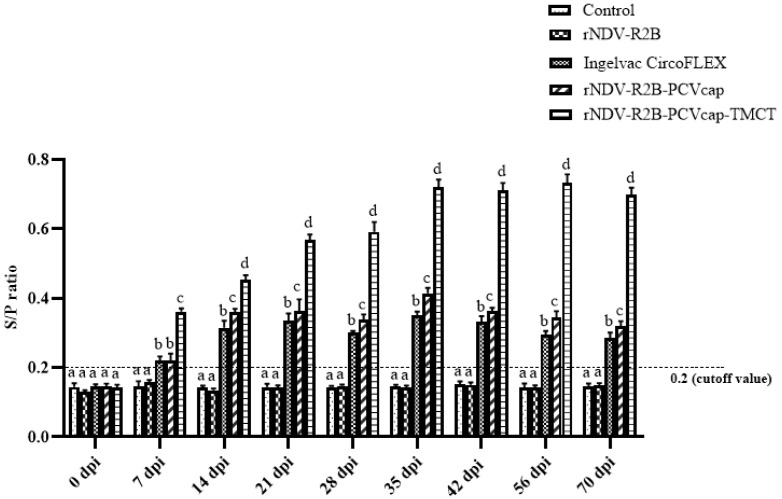
Figure 8.
PCV2-specific antibody responses measured by indirect ELISA in pigs of different groups (n = 5/group) from 0 dpi through 70 dpi. The cutoff value for positive antibody response is indicated at 0.2. Bars (Mean ± SE) indicate the representative data of a single experiment. Data with different small letters superscript indicate treatment effect (p < 0.05).

