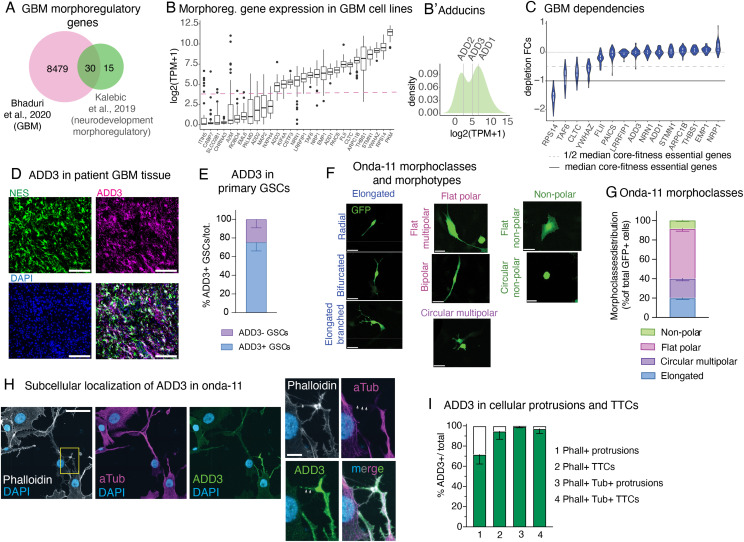
Figure 2. Onda-11 glioblastoma stem cells (GSCs) show morphological heterogeneity and are dependent on ADD3, a neurodevelopmental morphoregulator localized in GBM cell protrusions and tumor–tumor connections.
(A, B, C) Computational identification of ADD3 as a neurodevelopmental morphoregulator with a putative role in GBM progression. (A, B, C) Data are from Kalebic et al (2019) and Bhaduri et al (2020) (A) and Broad DepMap 22Q2 version and Sanger Cell Model Passports (B, C). (A) Intersection between a list of 8509 differentially expressed genes in primary GBM tumors and 45 neurodevelopmental morphoregulatory genes, resulting in 30 shared genes. (B) Log2(TPM + 1) expression levels of the resulted gene list (29/30) averaged across 48 annotated GBM cell lines from showing bimodal distribution (dashed line). (B′) Density plot of the average expression levels of the adducin family of genes indicating the estimated density with superimposed average expression levels of adducins. (B, C) Dependency of GBM cell lines (depletion fold change [FC] distribution upon CRISPR/Cas9 targeting) on the 15 highly expressed non-core-fitness genes from panel (B). (D, E) ADD3 is expressed by GSCs in the primary GBM tissue. (D) IF staining of the patient-derived GBM tissue for nestin (green) and ADD3 (magenta) along with DAPI staining (blue), max intensity projection (MIP) of 12 planes. Scale bar: 100 μm. (E) Quantification of the expression of ADD3 in primary GSCs (defined as nestin+, SOX2+). Error bars, SEM; n = 4 independent patient samples. (F) Onda-11 GSCs were transfected with GFP, and their cell morphology was analyzed 72 h later. Images are MIPs of 12 planes. Four different morphoclasses listed at the top of the images (elongated, circular multipolar, flat polar, and nonpolar) are further divided into eight morphotypes annotated on the left of the images (radial, bifurcated, elongated branched, circular multipolar, flat multipolar, bipolar, flat nonpolar, and circular nonpolar). Scale bars: 10 μm. (G) Analysis of Onda-11 morphology using GFP signal, 72 h after transfection, showing their morphological heterogeneity. Distribution of the four morphoclasses is shown (see also Fig S1J). Data are the mean of eight independent transfections. Error bars, SEM. (H, I) ADD3 is expressed in cellular protrusions and tumor–tumor connections of Onda-11 GSCs. (H) IF staining for actin (phalloidin, white), microtubules (alpha-tubulin, magenta), and ADD3 (green) along with DAPI staining (blue). Images are MIP of 12 planes. Scale bars: 50 μm (left); 10 μm (right). (I) Quantification of the expression of ADD3 in Onda-11 GSC protrusions and microtubes. Error bar, SD; n = 3 independent cell cultures.

