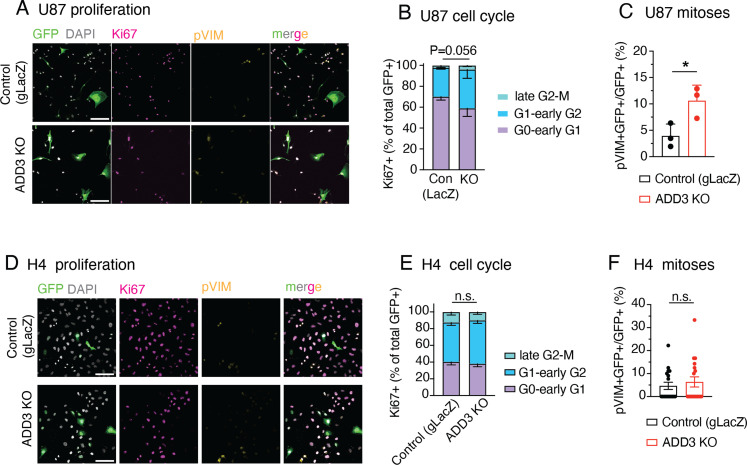
Figure S7. ADD3 effects on cell proliferation extend to other GBM cell lines, but not to other CNS cancer cell lines.
(A, B, C, D, E, F) U87-MG glioblastoma cells (labeled U87) (A, B, C) and H4 neuroglioma cells (D, E, F) grown as in Fig S3 were transfected either with an ADD3 KO plasmid or with a gLacZ KO plasmid as a control, and their proliferation was analyzed, revealing that ADD3 mildly affects proliferation of U87, but not H4 cells. (A, B, C, D) IF for Ki67 (magenta) and pVim (yellow) along with DAPI staining (white) in GFP+ (green) U-87 (A) and H4 cells (D) transfected with the control gLacZ plasmid (top) or ADD3 KO (bottom). Images are max intensity projections of 13 planes. Scale bar: 100 μm. (B, E) Distribution of the 3 Ki67 expression patterns (see Figs 5 and S5) in U-87 MG (B) and H4 (E) in ADD3 KO versus control. (C, F) Percentage of pVim+ GFP+ mitotic figures in control and ADD3 KO GFP+ U-87 (C) and H4 cells (F). (B, C, E, F) data are the mean of three independent transfections. (B, C, E, F) Error bars, SD (B, C) and SEM (E, F); *P < 0.05; n.s., not statistically significant; two-way ANOVA with Sidak’s post hoc tests (B, E), and t test (C, F).

