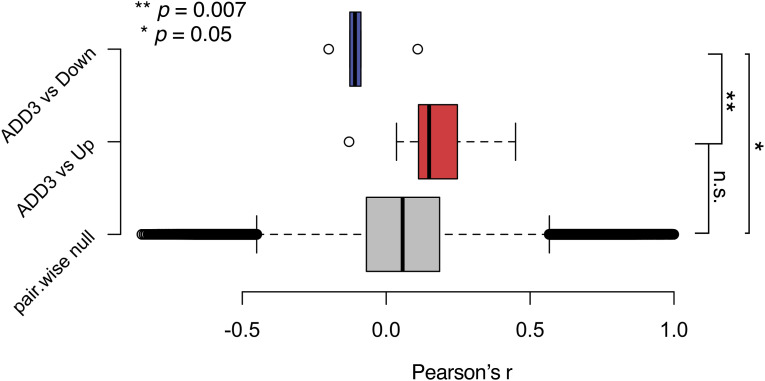
Figure S8. Differential gene expression upon ADD3 OE correlates with basal expression patterns in relation to ADD3.
Pairwise correlation scores were calculated across basal expression patterns of all possible gene pairs (gray distribution), ADD3 and up-regulated genes in the ADD3 overexpression signature (red distribution), and ADD3 and down-regulated genes in the ADD3 overexpression signature (blue distribution). Error bars, 95% CI; **P = 0.007; *P = 0.05; n.s., not statistically significant; t test.

