Figure 3.
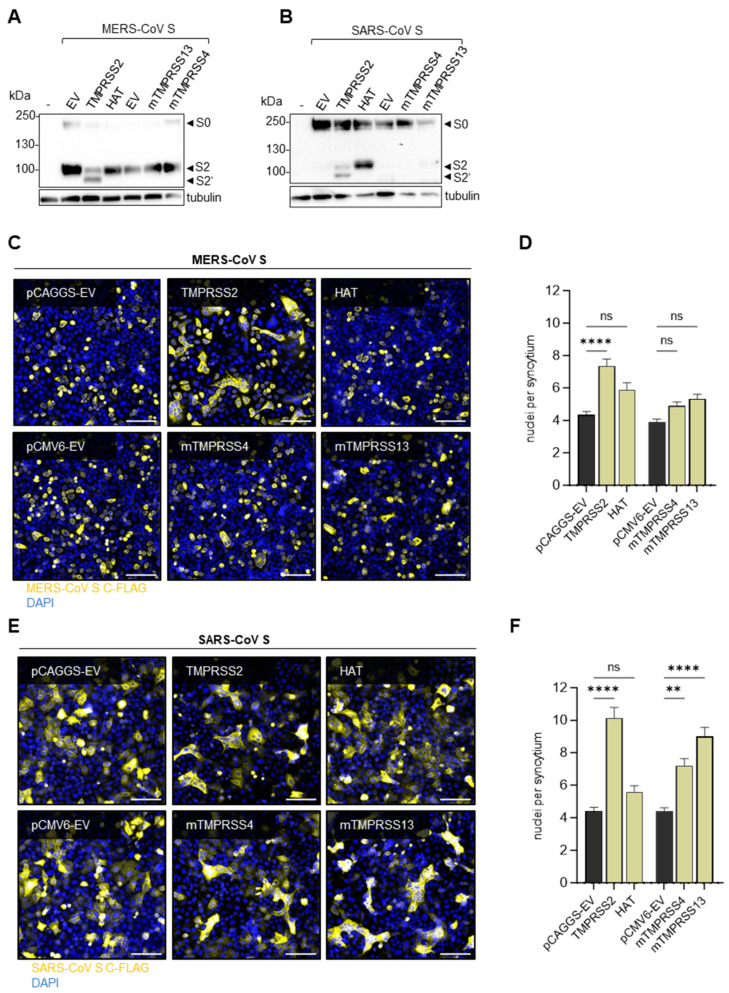
Activation of SARS-CoV and MERS-CoV S by TMPRSS2 and further host proteases. (A,B) HeLa cells were co-transfected with plasmids coding for MERS-CoV S (A) or SARS-CoV (B) with a C-terminal FLAG-tag and plasmids coding for human TMPRSS2 or HAT or murine TMPRSS4 or TMPRSS13. Cell lysates were analysed via SDS-PAGE at 48 h p.t. Western blot analysis was performed using an antibody targeting the C-terminal FLAG-tag. Tubulin was used as a loading control. The data shown are representative of three individual experiments. EV = empty vector. (C,E) HeLa cells co-expressing MERS-CoV (C) or SARS-CoV (E) S, as well as the respective receptors DPP4 or ACE2, were incubated for 48 h. After fixation, the cells were stained with a primary antibody targeting the C-terminal FLAG-tag of S and a fluorescence-coupled secondary antibody. DAPI was used to stain the nuclei. Representative images of three independent experiments are shown. The scale bar represents 100 µM. (D,F) Quantification of MERS-CoV S (D) or SARS-CoV (F) mediated cell–cell fusion. For each condition, ten randomly taken images were analysed by counting the nuclei per syncytium (with at least three nuclei). The data shown are the mean values + SEM of three independent experiments. Statistical significance was determined with a one-way ANOVA followed by Šídák’s multiple comparisons test. ns = not significant, ** = p < 0.01, **** = p < 0.0001.

