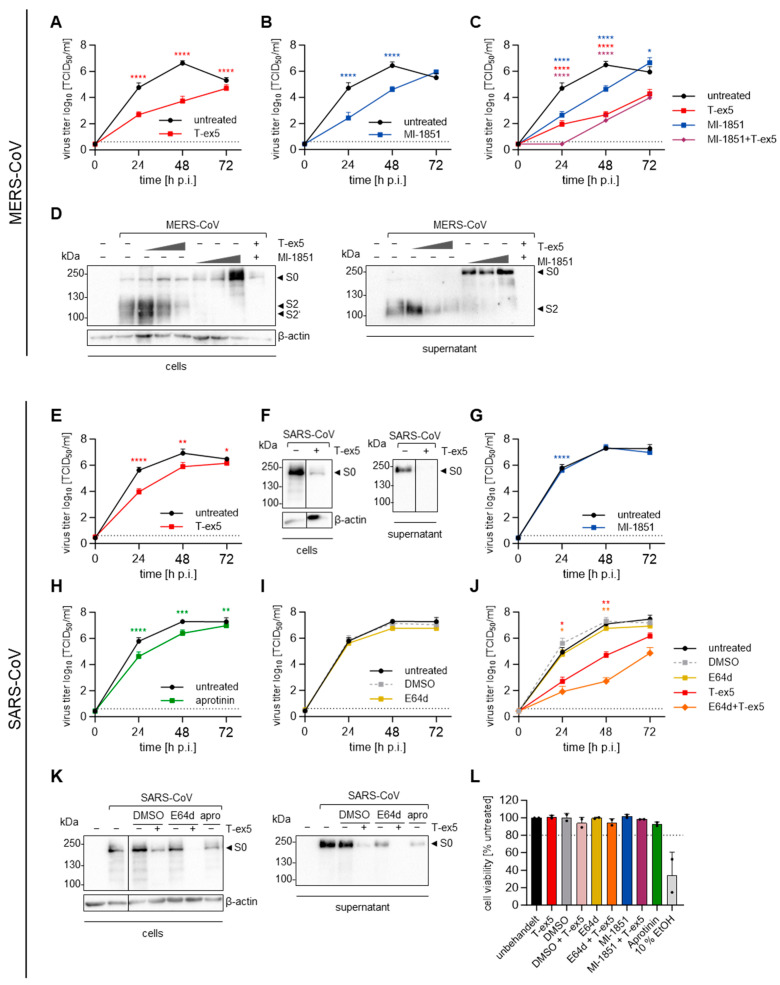
Figure 4.
Protease dependency of the multicycle replication of SARS-CoV and MERS-CoV in Calu-3 cells. (A–C) Calu-3 cells were treated with or without 25 µM T-ex5 for 24 h. The cells were then infected with MERS-CoV at an MOI of 0.001. After inoculation with the virus for 1 h, cells were treated with 50 µM MI-1851 or remained untreated. Viral titers in the supernatant sampled at the indicated time points were determined via TCID50 endpoint titration. The data shown are the mean + SD of three independent experiments. The dotted lines indicate the limit of detection (LOD). (D) Calu-3 cells treated with 5, 15 or 25 µM T-ex5 or left untreated were infected with MERS-CoV at an MOI of 1 and treated with 5, 10 or 50 µM MI-1851 or no inhibitor after 1 h inoculation. At 24 h p.i., the cell lysates and supernatant were subjected to SDS-PAGE, and Western blot analysis was performed with antibodies targeting the S2 subunit of MERS-CoV S. For the cell lysates, ß-actin was stained as a loading control. The data shown are the representative results of three independent experiments. (E,G–J) Calu-3 cells pre-treated with 25 µM T-ex5 for 24 h or left untreated were infected with SARS-CoV at an MOI of 0.001. After 1 h, the cells were washed and treated with 50 µM MI-1851 (G), 50 µM aprotinin (H), 50 µM E64d or DMSO (I,J). The supernatant was sampled at 0, 24, 48 and 72 h p.i. and the viral titers were determined via TCID50 endpoint titration. The experiments were performed three times and the data shown are mean + SD. The dotted lines indicate the LOD. (F,K) Calu-3 cells infected with SARS-CoV at an MOI of 1 were either pre-treated with 25 µM of T-ex5 or treated with 50 µM of the different inhibitors at 1 h after inoculation. After an additional 24 h, the cell lysates and supernatants were harvested for SDS-PAGE. Western blot analysis was performed with an antibody targeting the S2 subunit of SARS-CoV S and ß-actin was used as a loading control. The results are representative of three individual experiments. (L) Calu-3 cells were treated with 25 µM T-ex5 and/or 50 µM of the different inhibitors, or remained untreated, as in the previous experiments. At 72 h after inhibitor treatment, the cell viability was assessed and untreated cells were set to 100%, and inhibitors or combinations with over 80% cell viability (dotted line) were considered non-toxic. Treatment with 10% ethanol for 24 h served as a positive control. The data shown are the mean + SD of two independent experiments each performed in a technical triplicate. To determine the statistical significance of the differences in viral titers compared to untreated or DMSO-treated controls, an unpaired t-test (A,B,E,G–I) or a one-way ANOVA followed by Tukey’s multiple comparisons test (C,J) was performed for each individual time point. ns = not significant, * = p < 0.05, ** = p < 0.01, *** = p < 0.001, **** = p < 0.0001.

