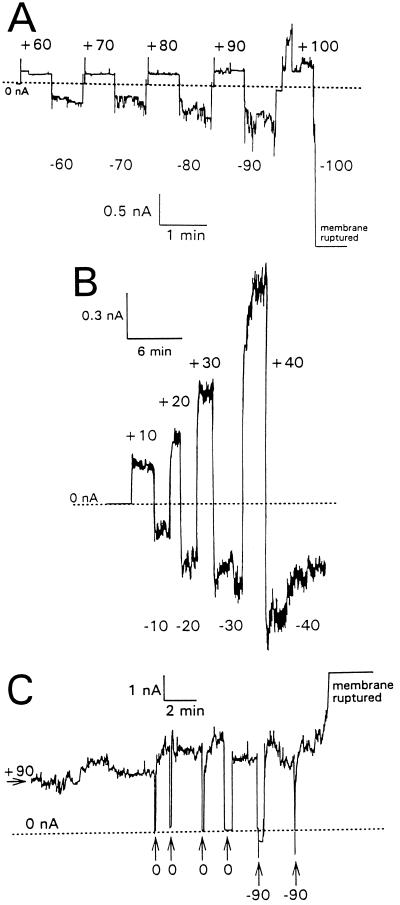
FIG. 2.
Voltage modulation of tPMP-1 membrane permeabilization. Membrane current is shown as a function of time with reference to the scales indicated. Base level membrane currents (which were near zero) are indicated by dotted lines. The values are membrane potentials in millivolts. Planar lipid bilayer membranes were formed in 0.1 M KCl containing 10 mM Tris-HCl (pH 7.4) and held at −90 mV. The following concentrations of tPMP-1 were then added to stable membranes held at the indicated membrane potentials: A, 1-ng/ml tPMP-1 at −90 mV; B, 40-ng/ml tPMP-1 at −90 mV; C, 100-ng/ml tPMP-1 at +90 mV. After tPMP-1-induced membrane permeabilization had been observed, the membrane potential was switched to 0 mV and the voltage was increased stepwise to the indicated values. For panel C, the membrane was kept at a potential of +90 mV and pulsed briefly with either 0 or −90 mV, as indicated.

