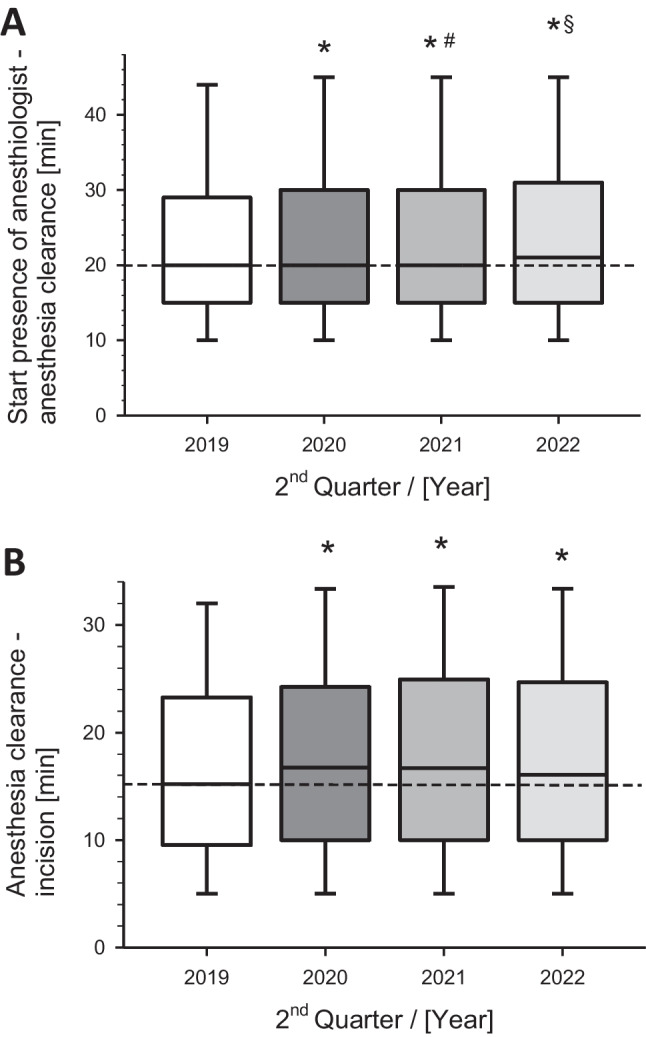
Fig. 2.

Perioperative process metrics of A) anesthesiologist presence until anesthesia clearance and B) anesthesia clearance until surgical incision of all operations during weekdays regarding the corresponding 2nd quarter of the year. Box-Whisker plots with median, 75th percentile upwards, and 25th percentile downwards. The whiskers upwards represent the 90th percentile, and those downwards represent the 10th percentile. *p < 0.01 versus Q2 2019 (pre-pandemia); #p < 0.01 versus Q2 2020 (pandemic crisis); §p < 0.01 versus Q2 2021 (pandemia)
