
Fig. 3.
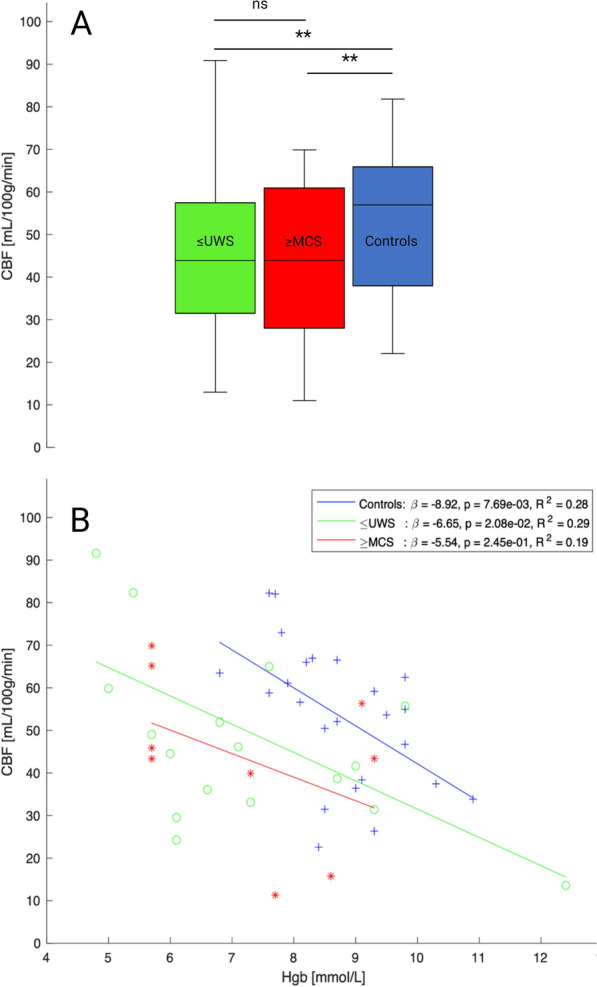
a Box and whisker plot showing cerebral blood flow (CBF) levels measured at 1.5 T arterial spin labeling magnetic resonance imaging in coma or unresponsive wakefulness state (≤ UWS) and minimally conscious state or better (≥ MCS) patients and healthy controls. ns, not significant. ** p < 0.005. b CBF of the three groups as a function of hemoglobin levels. Although statistically significant only in controls (p = 0.001), all groups showed decreasing CBF with increasing hemoglobin levels