
Figure 1.
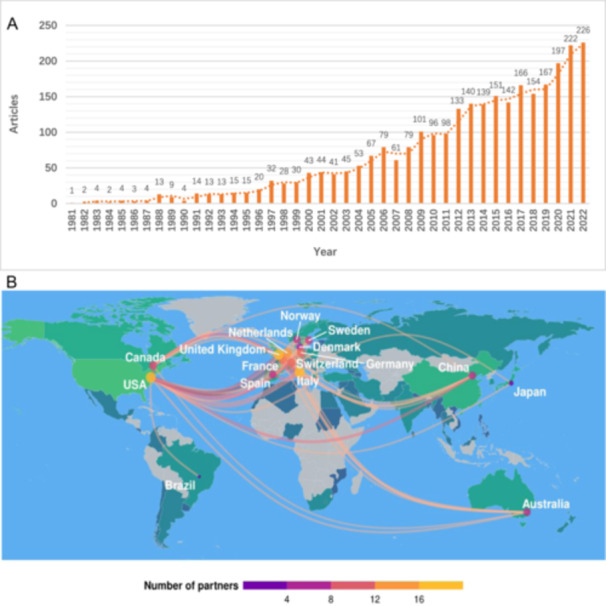
(A) Global annual scientific productions of ARVC since 1981. The horizontal axis represents time (years), and the vertical axis represents the global number of articles on ARVC published each year. (B) Distribution of major international collaborations. Major international ARVC research collaborations are marked on the map.