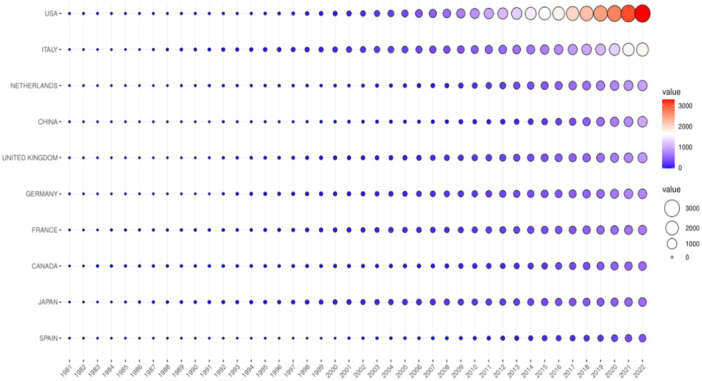
Figure 2.

Scientific publication from the top 10 contributing countries over time. The horizontal axis represents time (years). The vertical axis represents the top 10 countries with their cumulative scientific publications and related value over time (1981–2022).
