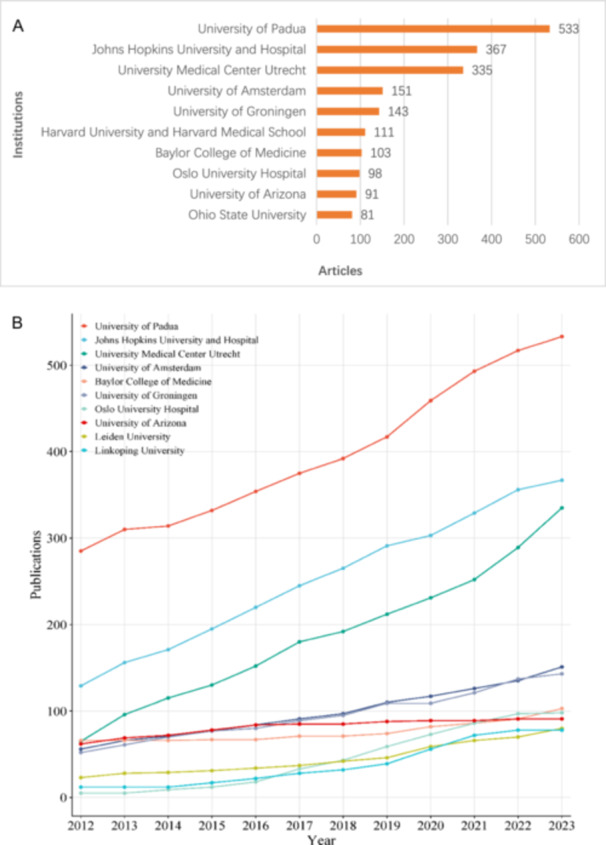
Figure 3.

(A) The top 10 institutions with most scientific productions accumulated. The horizontal axis represents the total number of scientific productions since 1981, and the vertical axis represents the top 10 organizations with affiliations with the most accumulated scientific publications from 1981 to 2022. (B) The top 10 institutions with most scientific publications on ARVC since 2012.
