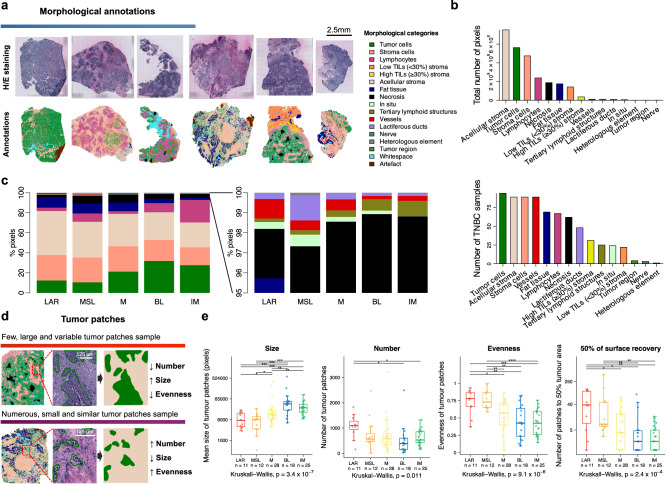
Fig. 3. Morphological analyses.
a Morphological annotation into fifteen histomorphological categories for one H/E-stained slide from the ST sections of each TNBC sample (right, color code). b Total number of pixels for each annotated histomorphological category (top) and the number of samples containing the different categories (bottom) (N = 94). c Distribution of morphological annotations across the five TNBC molecular subtypes, computed using ST global pseudobulk data (N = 94). d Illustration of distinct tumor patch patterns characterized by size, number, and diversity index (evenness). e Distribution of tumor patch metrics by TNBC molecular classification (N = 94). Statistical differences across subtypes were assessed using Kruskal–Wallis tests and Wilcoxon rank sum test (when comparing each subtype to each of the others). For Wilcoxon tests, FDRs were obtained by adjusting two-sided P values using Benjamini & Hochberg method (*FDR < 0.05 and ≥0.01, **FDR < 0.01 and ≥0.001, ***FDR < 0.001 and ≥0.0001, ****FDR < 0.0001). In boxplots, the boxes are defined by the upper and lower quartile; the median is shown as a bold colored horizontal line; whiskers extend to the most extreme data point which is no more than 1.5 times the interquartile range from the box. Source data and exact P values are provided as a Source Data file. BL basal-like, FDR false-discovery rate, H/E hematoxylin and eosin, IM immunomodulatory, LAR luminal androgen receptor, M mesenchymal, MSL mesenchymal stem-like, TNBC triple-negative breast cancer.

