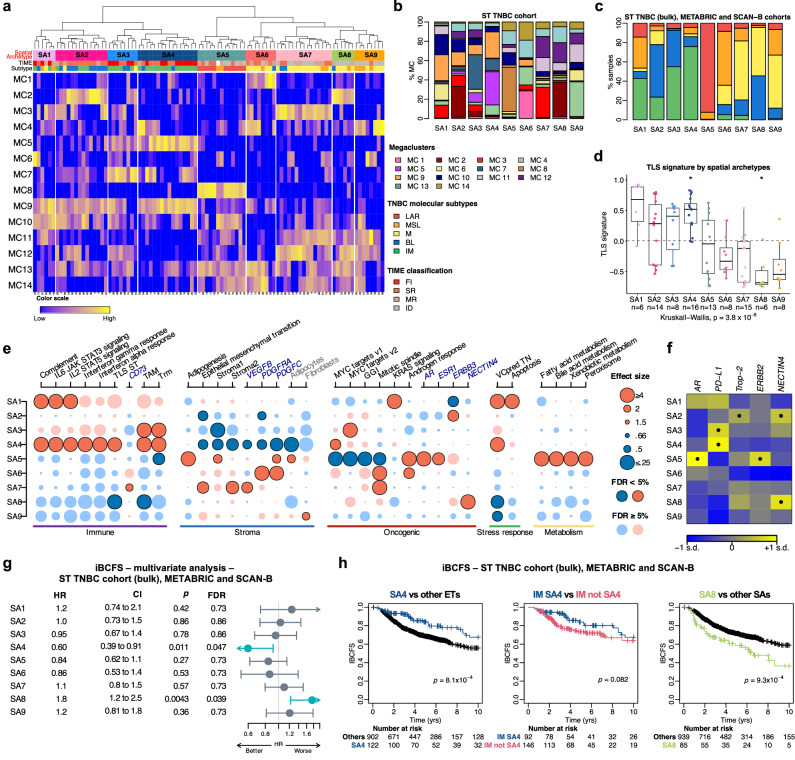
Fig. 8. Molecular and cellular characteristics of the nine spatial archetypes and their association with survival.
a Identification of the 9 SAs by hierarchical clustering of the 14 megaclusters. TNBC molecular subtypes and TIME spatial immunophenotypes are shown at the top. b Proportions of the 14 megaclusters within each SA in the ST TNBC cohort (global pseudobulk; N = 94). c Distribution of TNBC molecular subtypes across SAs in the combined TNBC cohorts (ST TNBC bulk, METABRIC, SCAN-B; N = 1101). d Distribution of the 30-gene TLS ST signature across SAs in the ST TNBC cohort. Two-sided P values are derived from Kruskal-Wallis and Wilcoxon rank-sum tests (one vs all). FDRs were calculated using the Benjamini & Hochberg method (*FDR < 0.05). Boxplots show quartiles, medians (bold line), and whiskers (1.5 times IQR). Dashed line indicates the mean TLS signature. e Molecular and cellular characterization of SAs in the ST TNBC cohort (N = 94), based on gene signatures, cell type enrichment, and single gene analysis. Dots are dark-colored when FDRs <0.05. Blue = negative, red = positive associations. Full details in Supplementary Fig. 20a, b, 21. f Expression of five targetable genes across SAs in combined TNBC cohorts (N = 1101). One-sided P values are derived from Wilcoxon rank sum test (one vs. all) and corrected for multiple testing. Positive associations (FDRs <10-5) are marked with dots; standard deviation labeled as “s.d.” g Association between SAs and iBCFS in the combined TNBC cohorts (N = 1101), adjusted for age, tumor size, and nodal status. Two-sided P values were derived from likelihood ratio tests on nested models, with significant FDRs (<0.05) shown in blue. Circles represent HR, and error bars indicate the 95% CI. h Kaplan-Meier plots showing iBCFS of SA4, IM in SA4, IM not SA4, and SA8 in the combined TNBC cohorts. P values from Cox regression stratified by study. Source data are available. BL basal-like, CI confidence interval, FDR false-discovery rate, FI full inflamed, GGI genomic grade index, HR hazard ratio, iBCFS invasive breast cancer-free survival, ID immune desert, IM immunomodulatory, LAR luminal androgen receptor, M mesenchymal, MC megacluster, MR margin restricted, MSL mesenchymal stem-like, SA spatial archetype, SR stroma restricted, TAM tumor associated macrophages, TIME Tumor Immune Microenvironment, TLS tertiary lymphoid structure, Trm tissue-resident memory T cell, VCpredTN veliparib carboplatin prediction triple negative.

