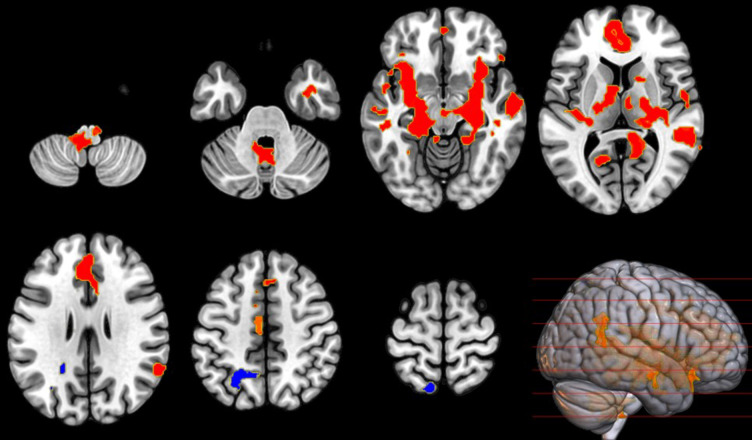
Fig. 6.
Figure 6:Insula connectivity change during CCM. Illustrates the change in FC, with left and right insula as a seed, between baseline control air and CCM, showing a significant increase (red) in FC in three clusters (MNI coordinates [− 30, +16, − 08], [− 08, − 44, − 38], and [+50, − 36, +06]) all showing T(23) > 2.50, k ≥ 665. A single cluster showed a decrease (blue) in FC in the (MNI coordinates: [− 20, − 52, +42]) with T(23) > 2.50 and cluster size k ≥ 952.

