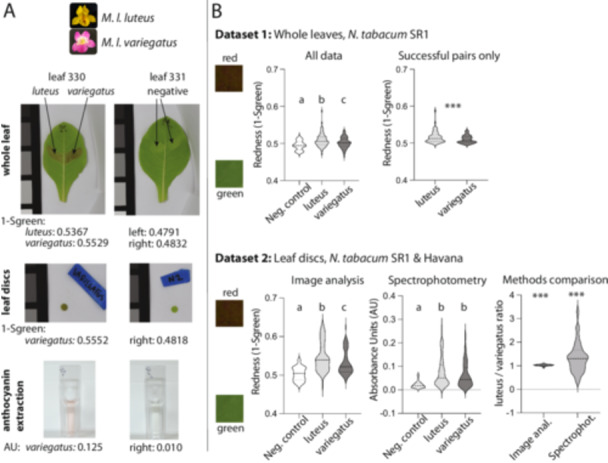
Figure 3.

MYB5a coding sequence from yellow‐petaled M. l. luteus drives greater anthocyanin pigmentation than coding sequence from the magenta‐petaled M. l. variegatus. (A) Whole‐leaf, leaf disc, and anthocyanin extraction images for leaves 330 and 331 from Data set 2. Anthocyanin content is indicated underneath each photo. Anthocyanin quantification obtained by image analysis is reported as 1‐Sgreen; that obtained by anthocyanin extraction and spectrophotometry is indicated by Absorbance Units (AU) using the formula A 530‐(0.24 × A 653). In both cases, higher values indicate redder leaf tissue. Greyscale color squares, for scale, are 25 mm on each side. (B) Data set 1 results for (left) all samples with N = 40 (negative control), 98 (luteus coding sequence), 98 (variegatus coding sequence) (right) matched luteus‐variegatus pairs for which both members of the pair produced visible pigmentation, with N = 66 pairs. Data set 2 results are shown for whole leaves and leaf punches from lines SR1 and Havana, with image analysis results on the left and spectrophotometry results on the right. Data set 2 sample sizes are N = 38 (negative control), 80 (luteus coding sequence), and 80 (variegatus coding sequence). In the Methods Comparison panel, the ratios of paired luteus‐ versus variegatus‐infiltrated leaf discs are shown, for anthocyanin calculated by image analysis compared to spectrophotometry. While both ratios were significantly higher than one, variance was noticeably larger with the spectrophotometry approach. In each violin plot, the median is shown as a dashed line and quartiles as dotted lines. Statistics: Letters a, b, and c are significance groupings at p < 0.05 based on a one‐way ANOVA with Tukey's post hoc test; *** indicates p < 0.001 based on a two‐tailed paired t test (Data set 1) or a one‐sample t test compared to a value of 1 (Data set 2). [Color figure can be viewed at wileyonlinelibrary.com]
