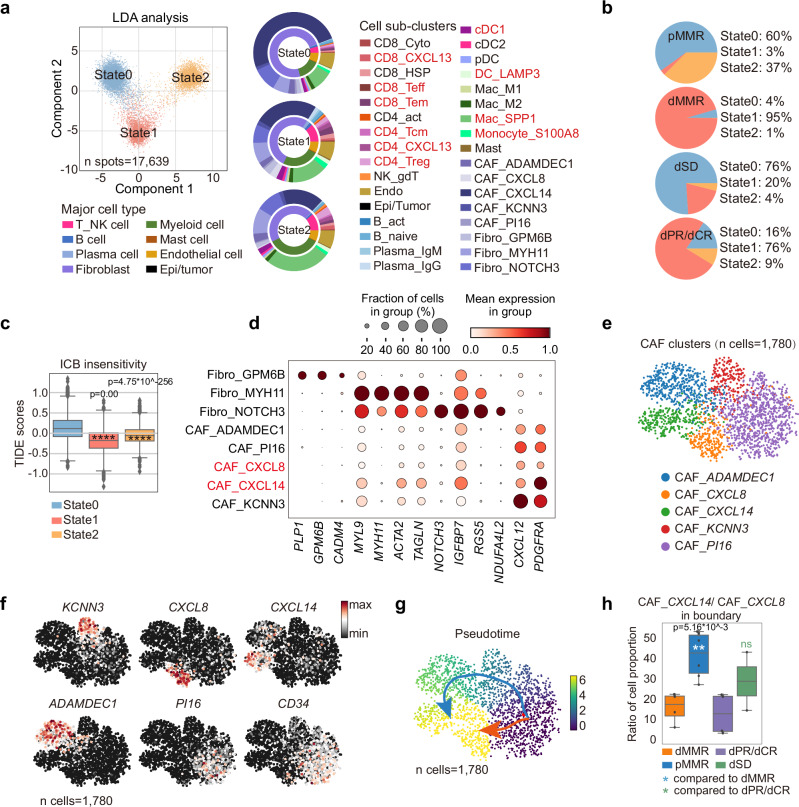
Fig. 4. The plasticity of CAF determines the immune status of tumor-stroma boundary in ICB non-responders.
a Linear discriminant analysis (LDA) of the three immune states in the tumor-stroma boundary (n spots=17,639). Nested donut charts show the proportions of cell clusters in the three states identified from scRNAseq data. The inner donut represents major immune cell types, while the outer donut represents immune cell subclusters. b Pie charts show the constitutions of immune states in the tumor-stroma boundary of the four patient groups. c The box and whisker plot shows the TIDE scores in the three identified cell states by TIDE algorithm are shown. Data are represented as mean±IQR and analyzed by unpaired 2-tailed Student t test. Ns, not significant; *, p < 0.05; **, p < 0.01; ***, p < 0.001; ***, p < 0.0001.. N number of the boundary spots: state 0 = 8835; state2 = 4450; state 3 = 4354. d Bubble plots of marker gene expressions in fibroblast subsets from the scRNA-seq dataset are shown. The plots are sized by the fraction of cells with positive gene expression, while the color represents the gene expression level. The name of the two CAFs are highlighted in red. e UMAP of CAF subclusters (n cells =1780; n samples: 5 pMMR, 2 dPR/CR, 3 dSD) are shown and (f) the representative marker genes are highlighted in each cluster from scRNAseq dataset. g Pseudo-time inference analysis of the 5 CAF clusters (n cells =1,780; n samples: 5 pMMR, 2 dPR/CR, 3 dSD) by Slingshots. Cells on the trajectories are aligned to the possible differentiation routes by the colored arrows. h The box and whisker plot shows the ratios of CAF_CXCL14/CXCL8 in the tumor-stroma boundary of indicated patient groups. Data are represented as mean±IQR and analyzed by unpaired Student t test. Ns, not significant; *p < 0.05; **p < 0.01; ***p < 0.001; ***p < 0.0001. N number of the patients: dMMR = 4; pMMR = 6; dPR/dCR = 4; dSD = 2.

